Everything inside
Every feature in Comma.
30+ updates shipped. 11 industry firsts. One private dashboard.
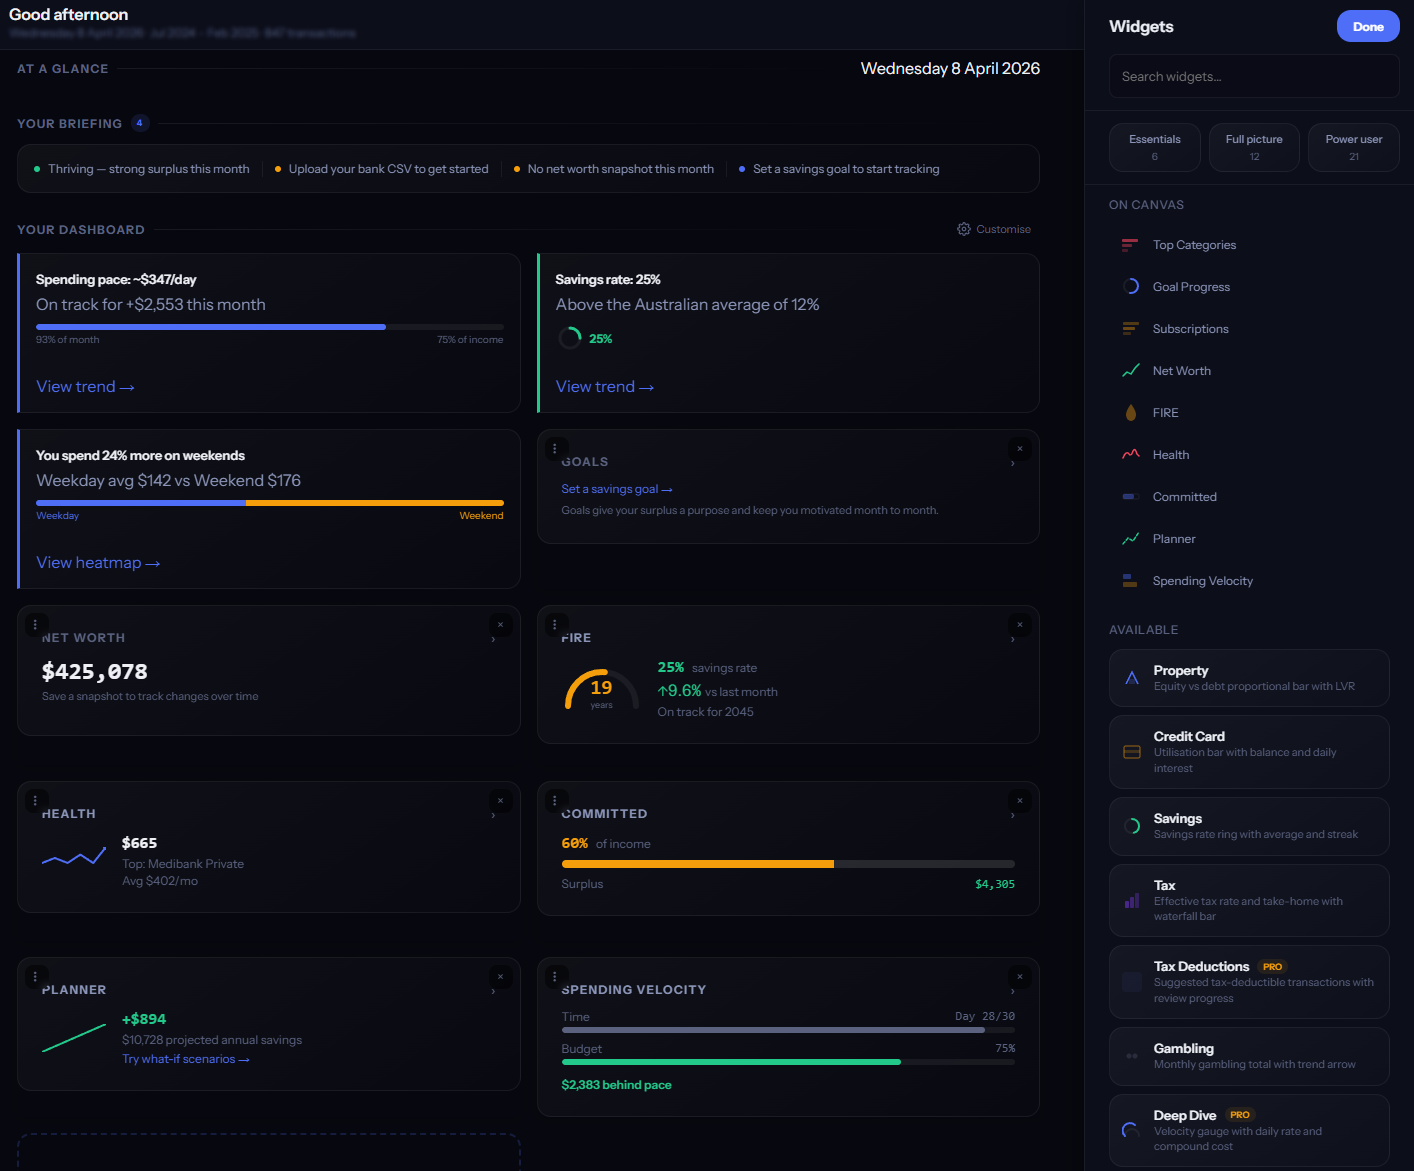
Widget Canvas
Build your dashboard from 20 widgets — spending, income, savings, goals, net worth, and more. Pick a starter layout (Essentials, Full, or Power), then drag, resize, and rearrange to make it yours.
- → 20 widgets covering spending, income, savings, goals, net worth, and more
- → 3 starter layouts: Essentials, Full, Power — switch instantly
- → Drag-and-drop with snap-to-grid and resize handles
- → Smooth animated transitions as you rearrange
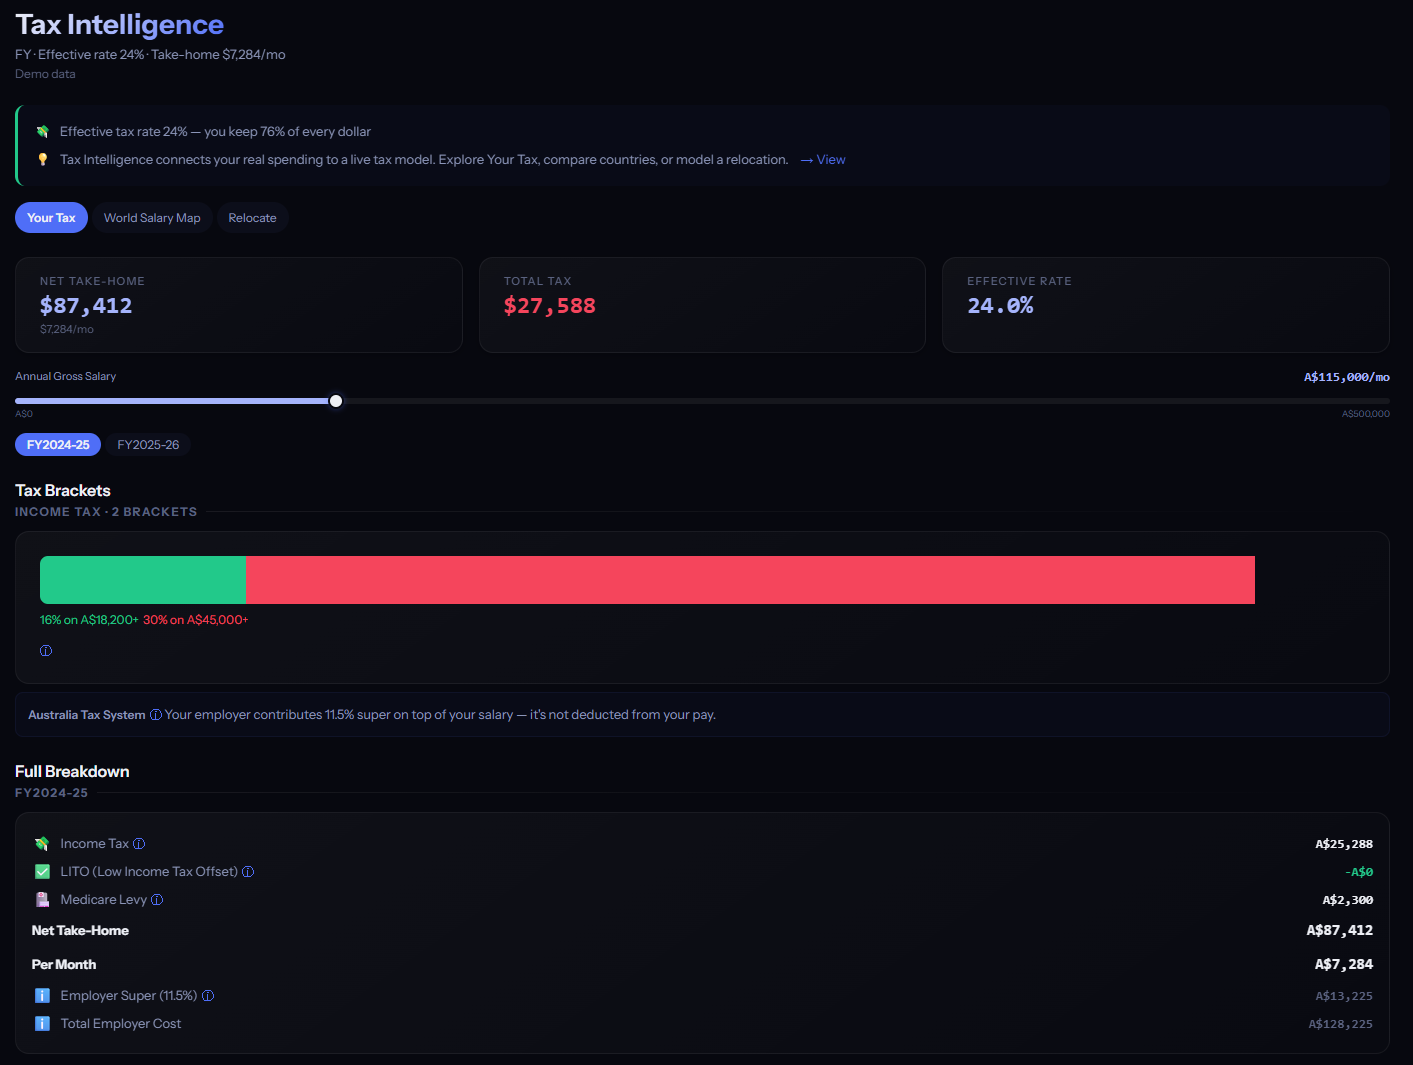
Tax Intelligence
Five tax calculators — Australia, UK, US, New Zealand, Canada — each with the right brackets, deductions, offsets, and retirement options for your country. A world salary map shows what your income is worth in every other country, adjusted for cost of living.
- → Five tax calculators with current-year brackets
- → World salary map — your income adjusted for cost of living
- → Relocation calculator — see your take-home pay in another country
- → Deductions tracked automatically from your transactions
- → Retirement accounts: Super, Pension, 401k, KiwiSaver, RRSP
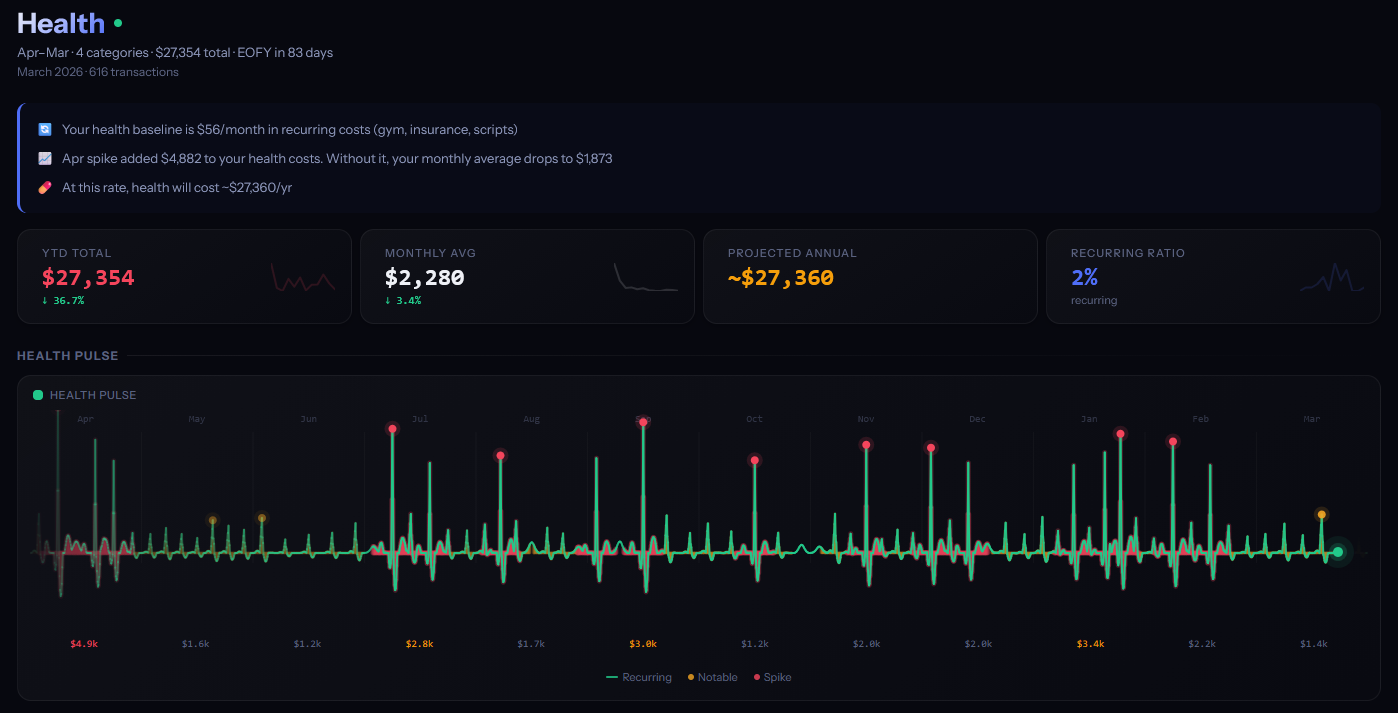
Health Intelligence
ECG-style vital signs for your finances that pulse with your data. Smart insights surface what matters — from how fast you're saving to how steady your spending is. Country-specific cards adapt to your tax system (Medicare levy in AU, NI contributions in UK, HSA in US, ACC in NZ).
- → Financial pulse chart — green when healthy, red when stressed
- → Smart insights that surface only when relevant
- → Country-specific cards: Medicare levy, NI contributions, HSA, ACC, and more
- → Connected to Comma Spark — your overall financial health pulse
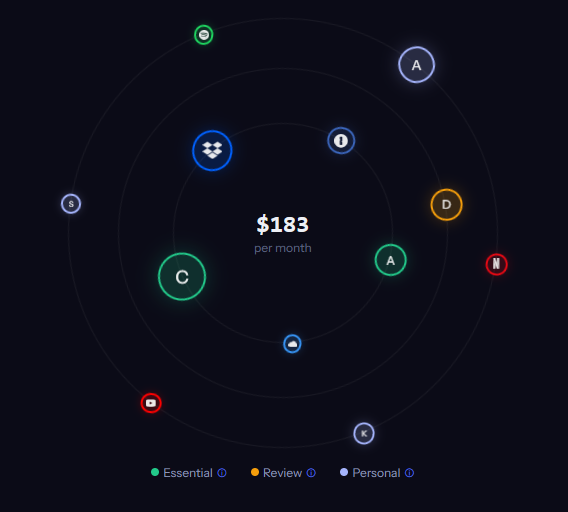
Subscription Orbit
Every recurring payment visualised as a planetary orbit. Comma auto-matches your subs to brand logos, catches silent price increases (when Netflix bumps you from $14.99 to $18.99), and flags services that do the same thing.
- → 87 brand logos auto-matched (Netflix, Spotify, AWS, and more)
- → Catches silent price increases between billing cycles
- → Overlap alerts — services with similar purposes highlighted
- → Cost-per-use ratings based on your actual usage patterns
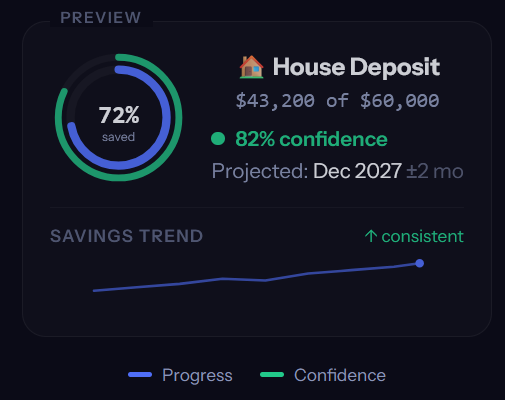
Goal Confidence Rings
Not just a progress bar — a confidence score. Each goal shows two rings: how far you've saved, and how likely you are to hit the target on time, based on your actual income and spending patterns.
- → Confidence calculated from your real income and spending
- → Two rings per goal: outer = progress, inner = confidence
- → Accounts for income variability and changing spending trends
- → Industry first — no other finance app shows you the odds of hitting a goal
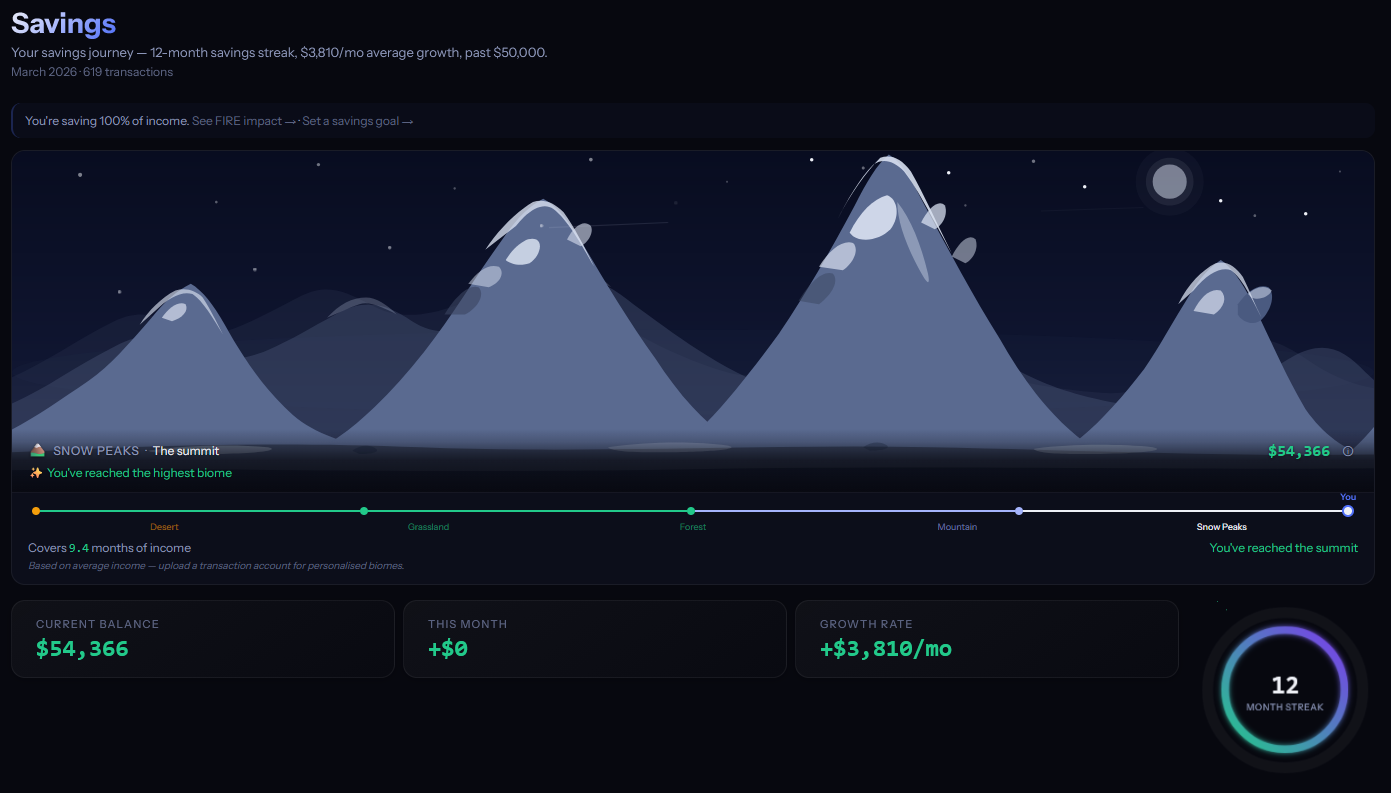
Net Worth Landscape
Your net worth as living terrain. Five biomes evolve as your wealth grows — from barren desert through grassland and forest to snow-capped peaks. The landscape grows with you.
- → 5 biomes: Desert → Grassland → Forest → Mountains → Snow Peaks
- → Animated transitions as net worth crosses thresholds
- → Monthly savings rate shown as a ring overlay
- → Visual metaphor that makes net worth feel tangible
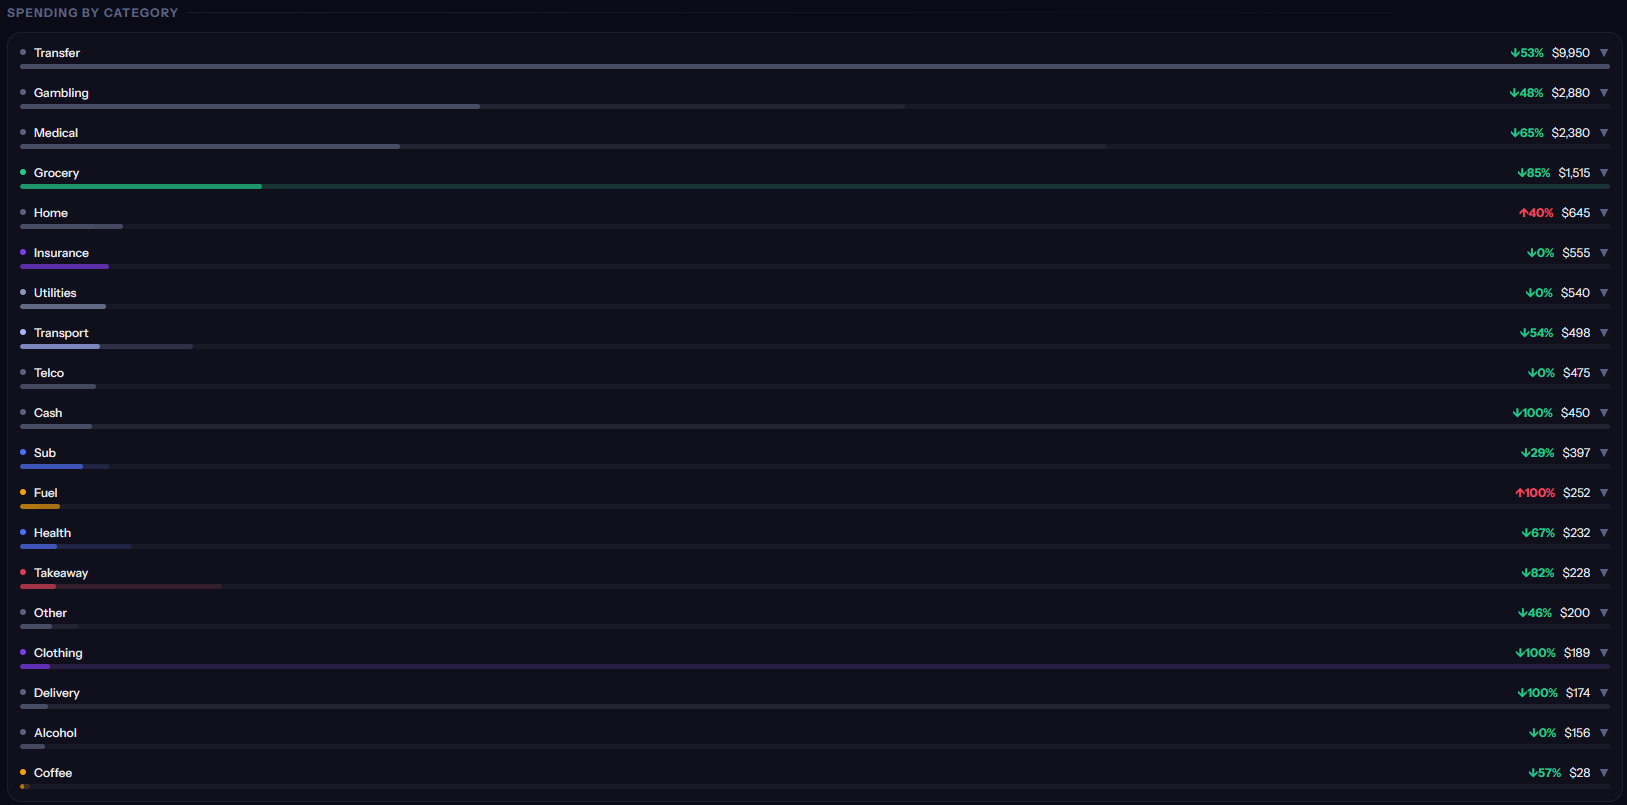
Smart Categorisation
Drag a CSV from anywhere in the app and 2,460+ merchant patterns categorise it for you. Before anything is saved, a preview shows exactly what's new versus what's a duplicate. The same merchant gets the right category whether you bank in Sydney or London.
- → 2,460+ merchant patterns across Australia, UK, US, NZ, and Canada
- → 50+ spending categories, each with its own emoji
- → Upload preview — see new vs duplicate transactions before saving
- → Recategorise once and Comma remembers it for every future import
- → Auto-detects transfers between your own accounts so you're not double-counted
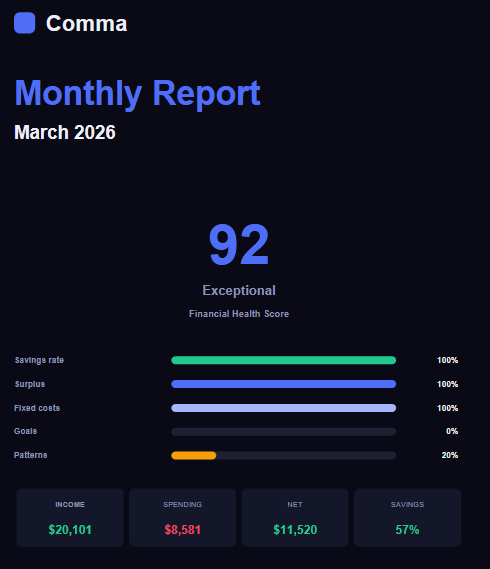
Monthly Reports
Auto-generated at month end with a 0–100 score across your income, spending, savings, and goals. Badges highlight wins. Export the whole thing as a PDF for your records or your advisor.
- → 0–100 score across income, spending, savings, and goals
- → Achievement badges: Top Saver, Budget Master, Streak Champion
- → Month-over-month comparisons with trend arrows
- → PDF export for records or sharing with an advisor
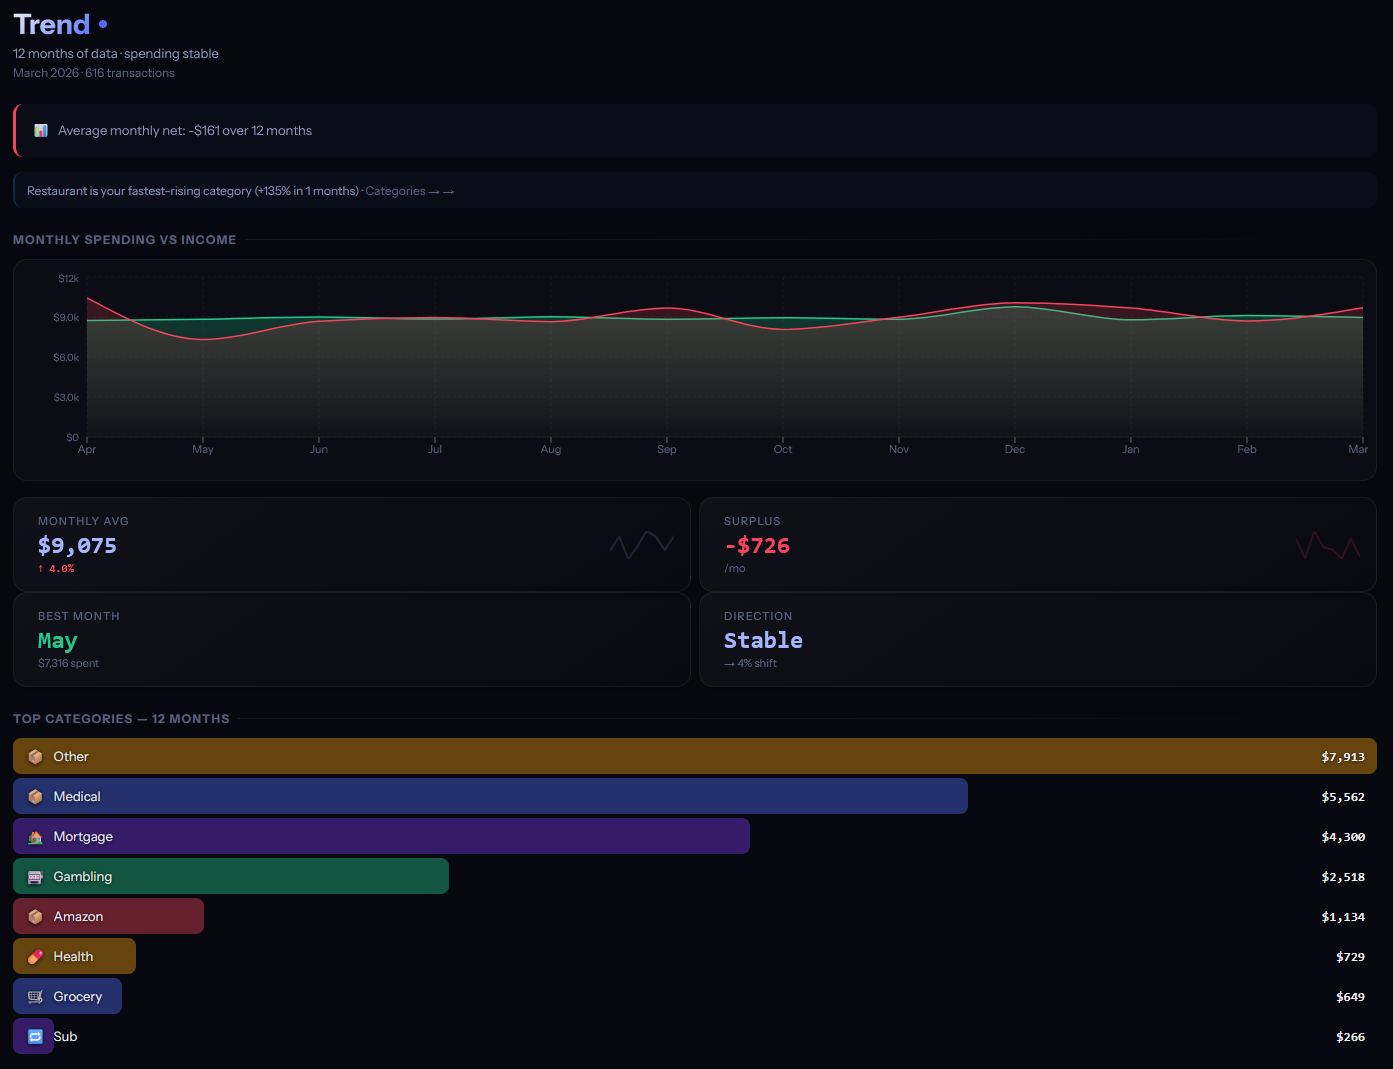
Trend Analysis
Income vs spending charted side by side, with trend arrows that show whether you're moving in the right direction. Mini-charts on every key metric show movement at a glance.
- → Hero area chart: income vs spending over time
- → Mini-charts for savings rate, surplus, and top categories
- → Trend arrows with a confidence indicator
- → Responsive — full chart on desktop, card stack on mobile
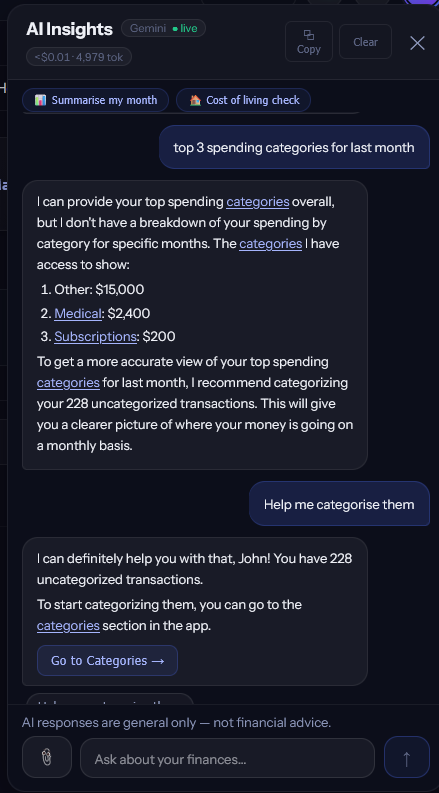
AI Chat
Bring your own API key for Claude, ChatGPT, or Gemini. Switch between providers without re-entering credentials. Attach photos of receipts or statements and ask the AI about them. Pick Quick, Balanced, or Deep reasoning. Citations in any answer link straight to the underlying transactions, and a live cost meter shows what each conversation costs.
- → Works with Claude (Anthropic), ChatGPT (OpenAI), and Gemini (Google)
- → Your API key stays on your device — never sent to our servers
- → Your browser talks directly to the AI — Comma is never in the middle
- → Attach images — photograph a receipt or statement and ask the AI about it
- → Smart caching cuts follow-up message costs to ~20% on Claude and ChatGPT
- → Anonymise toggle replaces your real names with generic placeholders before sending
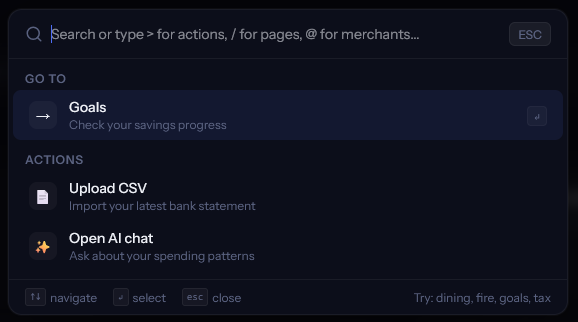
Cmd+K Command Palette
Keyboard-first navigation. Hit Cmd+K (or Ctrl+K) to search, navigate, or take action. Type a few characters and Comma finds what you need — even with typos. A smart summary card shows key metrics without leaving the palette.
- → Smart search across all tabs, categories, merchants, and actions
- → Summary card with key metrics at a glance
- → Keyboard shortcuts for power users
- → Accessible from any screen in the app
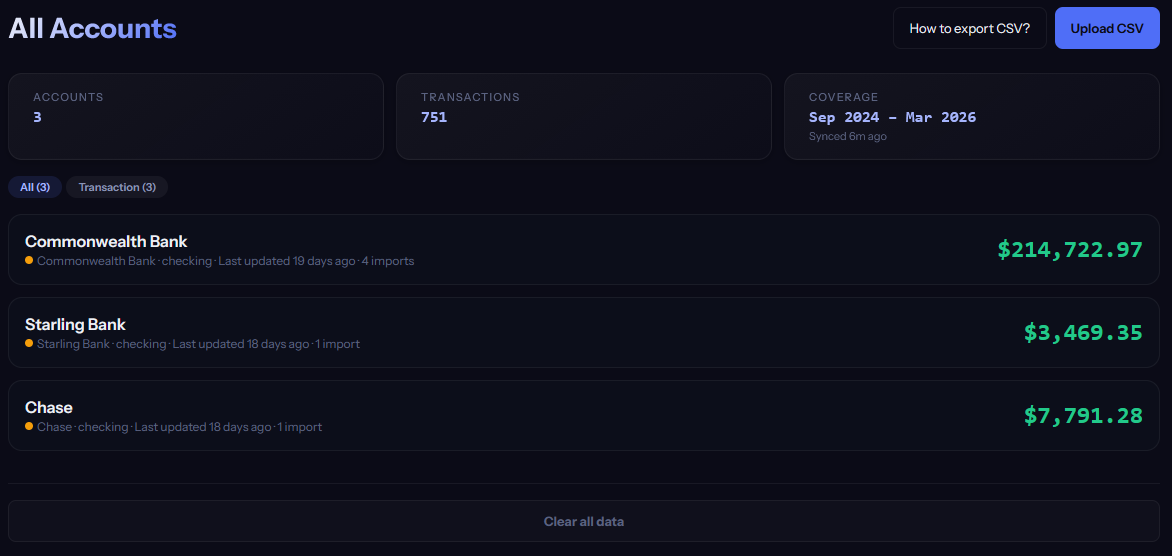
Multi-Account
8 account types: transaction, savings, credit card, offset, joint, investment, loan, and other. Transfer detection prevents double-counting. Dedicated credit card and savings pages with their own analytics.
- → 8 account types with distinct categorisation rules
- → Automatic transfer detection between your own accounts
- → Credit card page: statement tracking, payment matching, utilisation
- → Savings page: interest tracking, goal allocation, growth chart