Support
Help Centre
Everything you need to know about Comma.
Getting Started
What Comma is, how to start, and what you get for free.
6 articles
Your Dashboard
Customise your home screen with draggable widgets.
6 articles
Comma Spark
Your animated financial pulse indicator.
5 articles
Monthly Reports
Automated monthly scorecards with badges and PDF export.
4 articles
Smart Categorisation
Automatic transaction categorisation with 2,400+ merchant patterns.
6 articles
Subscription Intelligence
Detect, track, and optimise recurring subscriptions.
8 articles
Tax Intelligence
Five tax engines, world comparison, and relocation modelling.
8 articles
Health Intelligence
Financial health scoring with locale-specific insight cards.
5 articles
FIRE Dashboard
Financial Independence calculator with Monte Carlo simulation.
6 articles
Gambling Tracker
Net position tracking, session reconstruction, and harm reduction.
8 articles
Interactive Planner
Sankey flow diagram with slider-based budget planning.
5 articles
Goals & Confidence Rings
Savings goals with dual progress/confidence ring visualisation.
6 articles
Net Worth & Landscape
Balance sheet tracking with generative terrain visualisation.
5 articles
Multi-Account
Import from multiple banks with transfer detection.
19 articles
AI Chat
BYO-key AI financial advisor with direct browser-to-provider streaming.
8 articles
Command Palette
Quick search and navigation with keyboard shortcuts.
4 articles
Export
Export your data in CSV, Excel, or PDF format.
4 articles
Encryption & Privacy
AES-256-GCM encryption, encrypted on your device before storage.
6 articles
Bank Export Guides
Step-by-step CSV export instructions for major banks.
10 articles
Account & Billing
Pricing tiers, payments, and account management.
6 articles
Search & Transactions
Full-text transaction search with category filtering and recategorisation.
4 articles
Insights & Analytics
Day-of-week patterns, spending trends, heatmaps, and deep dives.
5 articles
Committed Spending
Fixed expenses like rent, insurance, and utilities.
4 articles
Property
Property assets, equity tracking, and mortgage balance.
1 articles
Settings
Locale, preferences, data management, and account settings.
4 articles
Getting Started
What Comma is, how to start, and what you get for free.
What is Comma?
Comma is a private finance system — your financial life, finally understood. It turns your bank CSV exports into a visual dashboard with categorised spending, net worth tracking, tax intelligence, FIRE projections, and more. Everything runs in your browser; your data never touches our servers unencrypted.
How do I get started?
Visit comma.finance, sign up for a free account, then drag and drop a CSV anywhere onto Comma. You can also click "Upload CSV" in the All Accounts tab. Comma works entirely in your browser — your transactions are encrypted on your device before any cloud sync.
- Sign up for a free account (or sign in if you already have one).
- Download a CSV from your bank's website (Transactions > Export > CSV).
- Drag the CSV onto Comma. It auto-detects your bank, shows a preview with the first 10 rows, and tells you how many transactions will be added vs skipped as duplicates. Nothing commits until you click confirm.
Which banks does Comma support?
Comma has step-by-step CSV export instructions for the top 5 banks in each of its 5 supported countries: • Australia: CBA, ANZ, NAB, Westpac, Macquarie, BankWest, Up Bank, St.George, BOQ • UK: Monzo, Starling, Barclays, HSBC UK, Lloyds, NatWest, Santander • US: Chase, Bank of America, Wells Fargo, Capital One, Citi, Amex, Discover • Canada: RBC, TD, Scotiabank, BMO, CIBC, Tangerine • New Zealand: ANZ NZ, ASB, BNZ, Westpac NZ, Kiwibank • Global neobanks: Revolut, Wise If your bank isn't in this list, Comma's column mapping tool lets you manually map any CSV format — and you can submit your bank format from inside the app to have it added to the auto-detect list. Only the column header row leaves your device; the actual transactions stay in your browser.
What happens after I sign up?
A first-run wizard opens automatically. It walks you through three short steps: 1. Locale — pick your country (AU / UK / US / CA / NZ) so tax brackets, currency, and merchant patterns match where you bank. 2. Upload your first CSV — drop it in or click to browse. Comma auto-detects the bank format, shows a preview with the first 10 rows, and tells you how many transactions are new vs duplicates before anything commits. 3. Land on your dashboard — a guided tour fires highlighting the Spark hero (your money state), the Categories breakdown, and a "set your first goal" prompt at the finale. Goal-setting is intentionally not in the wizard — Comma asks you to plan after you've seen your data, not before. You can also set goals any time from the Goals tab. If you skip the tour, the same prompts surface on the dashboard via the Briefing panel and on tab empty states.
Is Comma free?
Comma has a generous free tier that includes the full dashboard, all tabs, smart categorisation, net worth tracking, Comma Spark, and 30 days of transaction history. Pro (from $99 USD / $149 AUD / £79 GBP one-time) adds 12 months of history, AI chat, goal projections, tax planning tools, and deep dive analytics. Lifetime (from $199 USD / $299 AUD / £149 GBP one-time) adds unlimited history and every future feature. No subscriptions — you pay once.
Why does Comma use CSV files instead of connecting directly to my bank?
Bank API connections (like Plaid or Yodlee) require sharing your banking credentials with a third party, creating a permanent data pipeline that can be breached. Comma's CSV approach means your bank never knows Comma exists, no third party holds your credentials, and you control exactly which data enters the app. The tradeoff is a manual export step every few weeks — but your data stays yours.
Your Dashboard
Customise your home screen with draggable widgets.
What is the widget canvas?
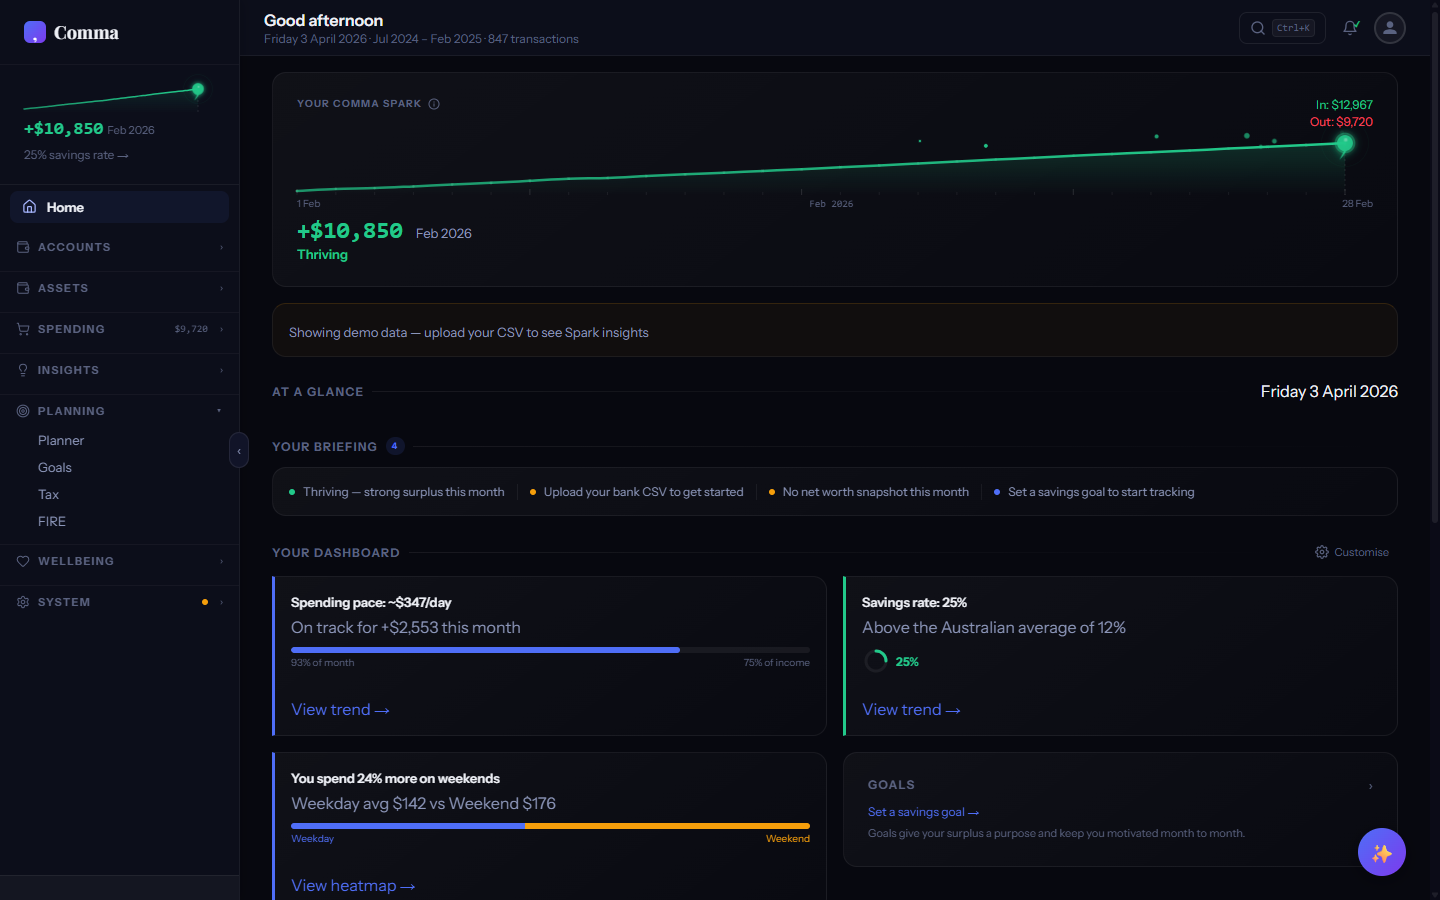
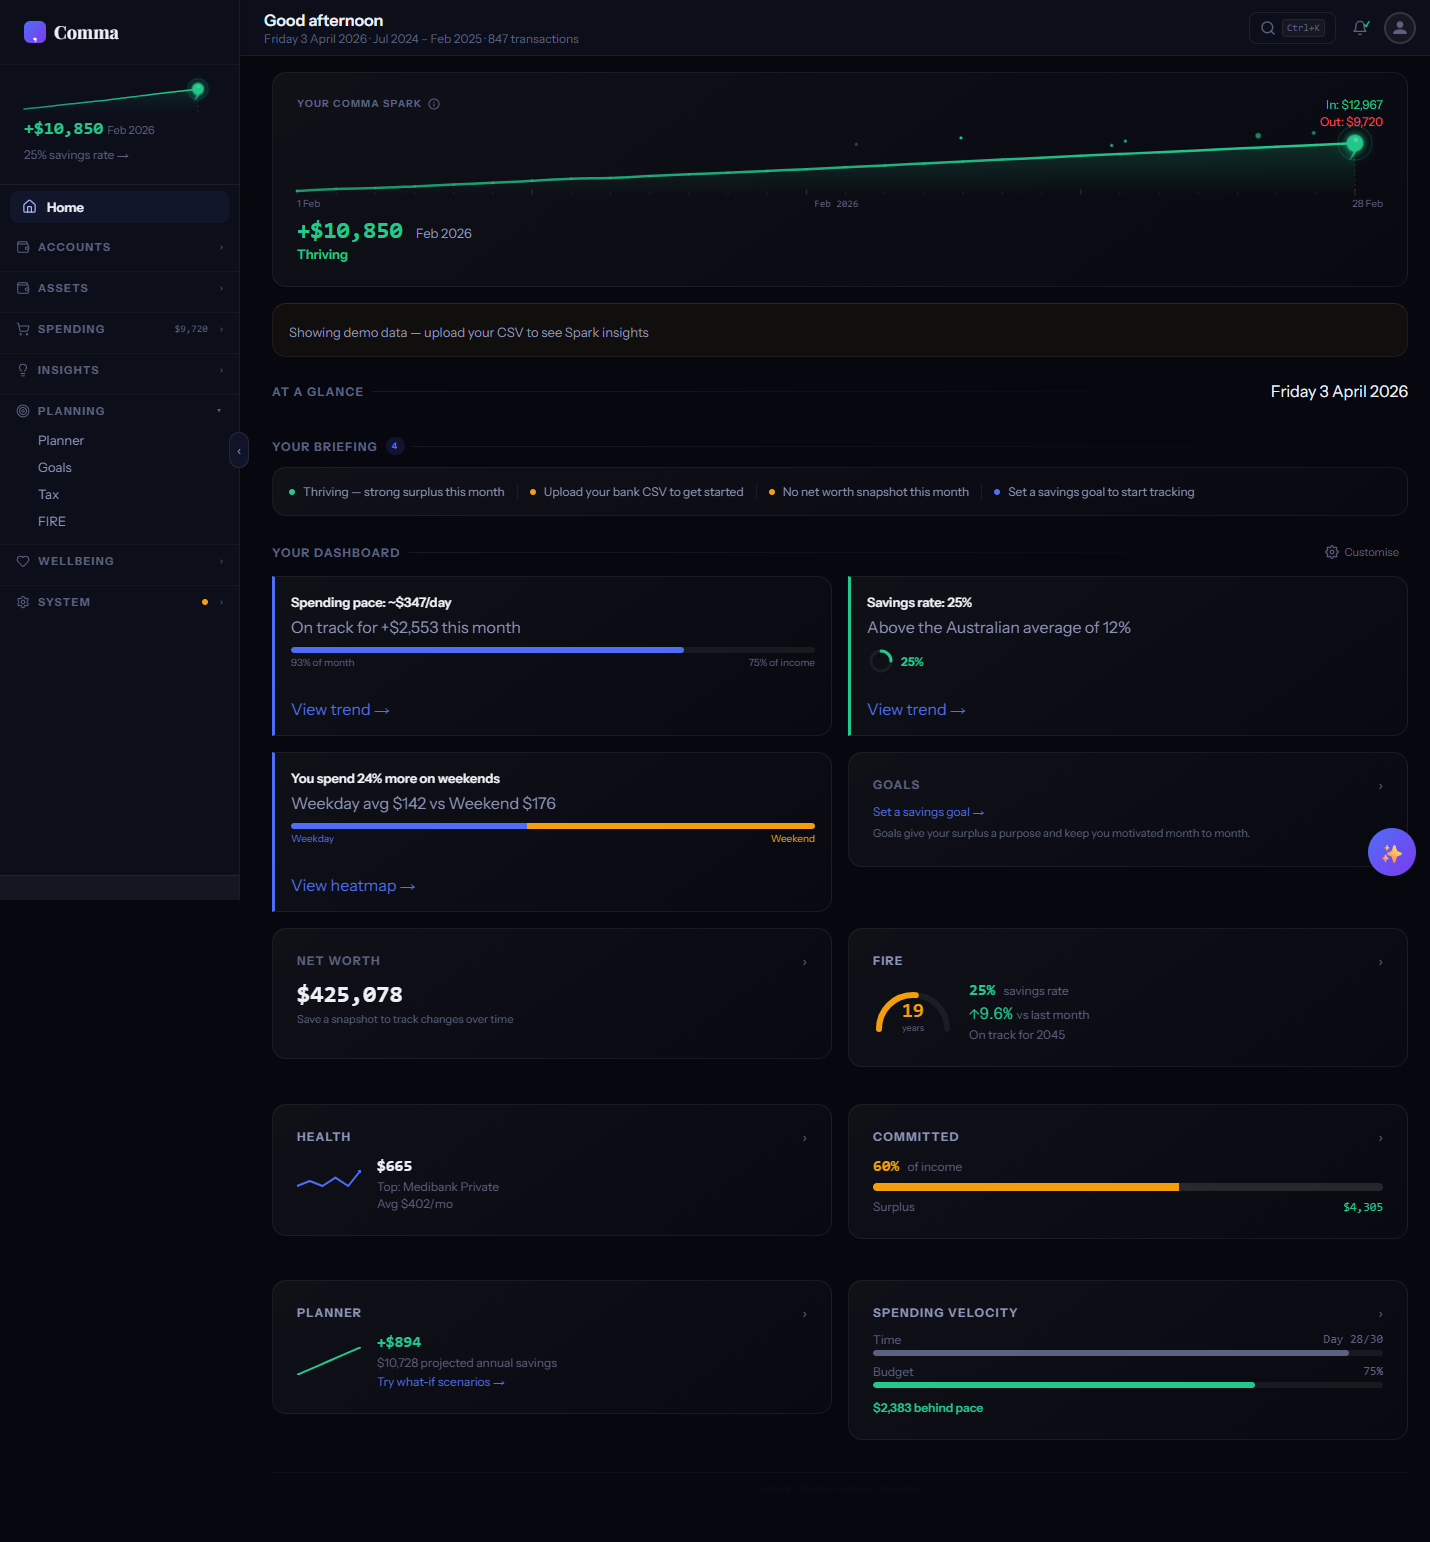
The dashboard home screen is a customisable canvas of widgets — each one is a live summary card for a different part of your finances (spending pace, savings rate, net worth, goals, subscriptions, and more). You can add, remove, resize, and reorder widgets to build the dashboard that matters to you.
How do I add or remove widgets?
Click the "Customise dashboard" button (paintbrush icon) in the YOUR DASHBOARD section header. This opens the Widget Gallery where you can toggle any of the 18 available widgets on or off. Changes apply instantly with smooth FLIP transitions.
Can I resize widgets?
Each widget supports three sizes: Small (S), Medium (M), and Large (L). Open the Widget Gallery via the customise button and adjust the size selector for any widget. Larger sizes show more data — for example, the Cash Flow widget at size L shows a full income-vs-spending area chart, while at size S it shows just the headline number and sparkline.
What are layout presets?
Presets are pre-configured widget arrangements for common use cases. Choose from options like "Overview" (balanced view), "Investor" (net worth and FIRE focused), or "Budgeter" (spending and categories focused). Selecting a preset instantly rearranges your widgets — you can then customise further from there.
How does the dashboard work on mobile?
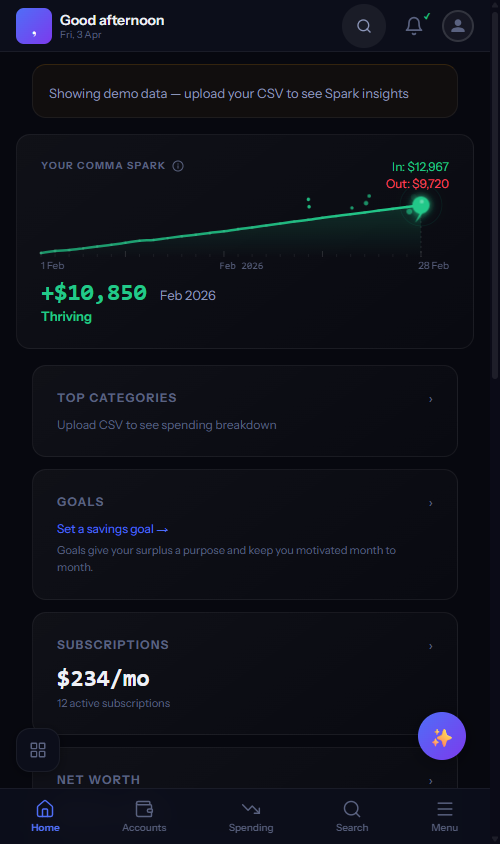
On mobile, the dashboard switches to a story-mode layout — widgets stack vertically as tappable cards instead of a grid. The Comma Spark hero sits at the top, followed by horizontally scrollable summary cards (categories, goals, subscriptions, net worth). Each card links to its full tab for deeper exploration. A bottom navigation bar provides quick access to Home, Accounts, Spending, Search, and a Menu drawer for all other tabs.
What is the "Your Briefing" section?
Your Briefing is a contextual notification area at the top of the dashboard. It shows actionable items like uncategorised transactions, stale CSV uploads, missing net worth snapshots, or goals that need attention. Each briefing item links directly to the relevant screen so you can take action in one tap.
Comma Spark
Your animated financial pulse indicator.
What is Comma Spark?
Comma Spark is your animated financial pulse — a living comma symbol that reflects your current financial state. It sits at the top of your dashboard and in the sidebar, pulsing and changing colour based on your income-vs-spending ratio for the current month. Think of it as a heartbeat monitor for your money.
What do the five Spark states mean?
Thriving (green, large pulse): surplus is more than 20% of income — you're saving strongly. Healthy (green, moderate pulse): positive surplus between 5-20% of income. Tight (amber, gentle pulse): spending is within 5% of income either way — on the edge. Stressed (red, tilted): spending exceeds income this month. No Data (grey, flat): no transactions uploaded yet — upload data to bring your Spark to life.
How is Spark calculated?
Spark calculates the ratio of (income minus spending) divided by income for the current month. If the ratio is above 0.2 (20%+ surplus), you're Thriving. Between 0.05 and 0.2 is Healthy. Within 5% either way is Tight. Below -0.05 is Stressed. If there's no data at all, it shows the flatline state.
What does the Spark hover card show?
Hovering over Spark reveals a detail card with your monthly income, spending, and net surplus/deficit as exact figures. It also shows the current state label (e.g. "THRIVING"), a contextual message (e.g. "All clear — surplus on track at $6,927/mo"), your surplus streak count, savings rate percentage, and quick-action buttons to view your trend or check goals.
Why did my Spark state change?
Spark recalculates whenever your transaction data updates — uploading a new CSV, the month rolling over, or recategorising transactions can all shift your income/spending ratio across a threshold. Check the Spark hover card to see the exact numbers driving your current state.
Monthly Reports
Automated monthly scorecards with badges and PDF export.
What is the Monthly Report?
The Monthly Report is an automated scorecard that grades your financial month on a 0-100 composite score. It evaluates savings rate, spending consistency, category distribution, and goal progress, then awards badges for achievements like "Saver" or "Under Budget." Reports generate automatically at month-end from your uploaded data.
How is the composite score calculated?
The composite score (0-100) blends weighted metrics: savings rate (how much you saved vs earned), spending velocity (whether you front-loaded or spread spending), category health (diversity of spending, no single category dominating), and goal progress (movement toward your targets). Each metric contributes to the overall grade — A+ through F.
What are report badges?
Badges are achievements earned each month based on specific criteria — for example, "Surplus Streak" for consecutive months in the green, "Budget Master" for staying under target in all categories, or "Goal Getter" for hitting a savings milestone. Badges appear on your report card and build up over time as a history of financial wins.
Can I export my monthly report as a PDF?
The Monthly Report can be exported as a formatted PDF via the Export tab. The PDF includes your composite score, all badges earned, category breakdowns, and trend charts — useful for sharing with a partner or financial advisor. All PDF generation happens client-side using jsPDF; nothing is sent to a server.
Smart Categorisation
Automatic transaction categorisation with 2,400+ merchant patterns.
How does auto-categorisation work?
When you import a CSV, each transaction description is matched against locale-specific merchant pattern libraries — over 1,400 patterns across AU, UK, US, CA, NZ, and global merchants. Uber and UberEats are properly separated, BNPL providers (Afterpay, Klarna) are detected, and gambling transactions are flagged automatically. Unmatched transactions appear as "other" for you to categorise with one tap.
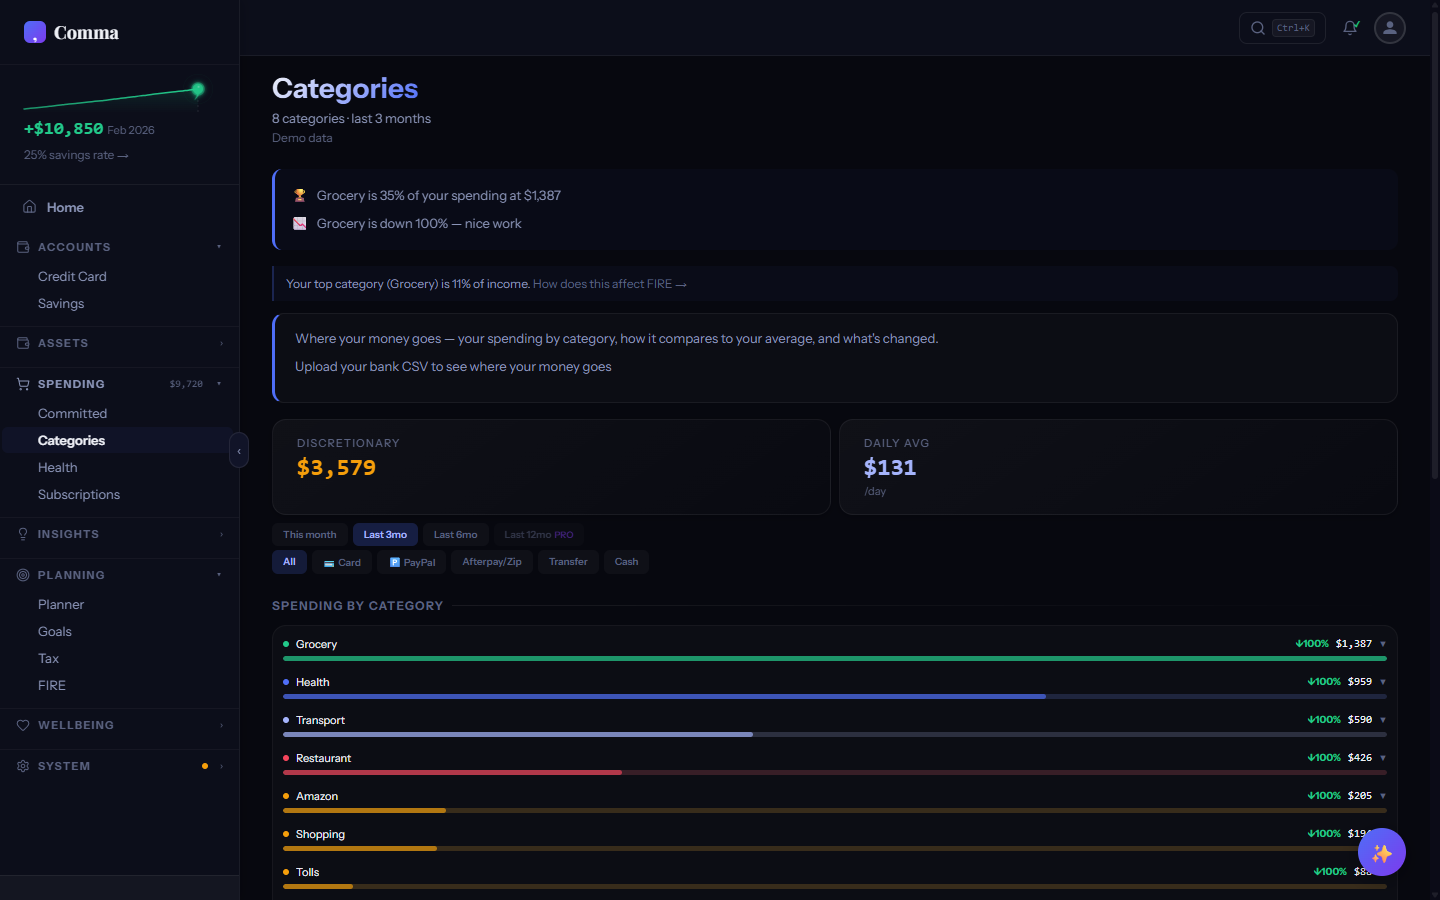
How many categories does Comma support?
Comma has 60 spending categories covering everything from groceries, dining, and transport to subscriptions, health, insurance, childcare, and gambling. Categories are grouped visually with proportional bars showing relative spending. You can hide categories you don't use via Settings > Categories.
How do I fix a wrong category?
Go to the Search tab, find the transaction, and tap it to change its category. Comma learns from your corrections — once you categorise a merchant, all future transactions from that merchant are automatically assigned the same category. Your custom rules are saved to localStorage and persist across sessions.
Can I create custom categorisation rules?
When you recategorise a transaction in Search, Comma extracts the merchant pattern and creates a rule. Before it applies, a preview modal shows every affected transaction so you can see exactly what will change. You can choose to apply the rule to all matching transactions (past and future) or only to new imports going forward — useful when old transactions were intentionally categorised differently. User rules take priority over built-in merchant patterns and are stored locally.
Are merchant patterns different for each country?
Each supported locale (AU, UK, US, CA, NZ) has its own merchant pattern library tuned to local retailers, banks, and services. Australian patterns recognise Woolworths, Coles, and Medicare; UK patterns know Tesco, Sainsbury's, and NHS; US patterns match Walmart, Target, and Kaiser. Global patterns (Apple, Google, Amazon, Netflix) apply everywhere.
Can Comma flag tax-deductible transactions?
With Pro or Lifetime, Comma's tax intelligence automatically flags transactions that may be tax-deductible based on merchant patterns and category — for example, work-related expenses, professional memberships, or health insurance premiums. Flagged transactions appear with a tax badge in Categories and are summarised in the Tax tab.
Subscription Intelligence
Detect, track, and optimise recurring subscriptions.
How does Comma detect my subscriptions?
Comma scans your transaction history for recurring charges from the same merchant at regular intervals (weekly, fortnightly, monthly, quarterly, semi-annual, or annual). For each merchant it groups transactions, prunes refund/reversal pairs, filters out salary, and measures cadence stability + amount stability. A merchant needs at least 3 occurrences (4 for weekly) on a recognisable cadence with ≥75% in-window confidence to qualify. Subscriptions are amount-stable services like Netflix or Spotify (variance under 10% across occurrences). Bills with stable amounts but a service-relationship character — phone, internet, electricity, gas, water, insurance, childcare, mortgage — are routed to the Committed tab instead. Pay-per-use services (Uber, Lyft, DoorDash, Deliveroo, Menulog) also route to Committed, even when amounts happen to be flat from a regular routine. Genuine subscription products from those brands (Uber One, DashPass, Deliveroo Plus) still appear on Subscriptions. Detection improves with more transaction history — 3+ months gives the best results, 6+ months unlocks drift detection.
What does the Essential / Review / Personal chip on each row do?
The pill chip beside each subscription name shows how Comma classifies it: • Essential — work tools, security, storage, mental health (Adobe CC, 1Password, Microsoft 365). Hard to drop without consequence. • Review — mainstream services worth periodic auditing (Netflix, Spotify, ClassPass). • Personal — niche entertainment, lifestyle subscriptions, hobby boxes. Classification comes from a curated list of ~210 globally-known services, falls back to your Comma category if no match, and defaults to Review for anything unrecognised. The bar colour next to each row matches the chip. Tap the chip to cycle through Essential → Review → Personal — your choice persists, syncs across devices, and overrides the default for that merchant forever. Hover the chip (desktop) to see why Comma classified it the way it did.
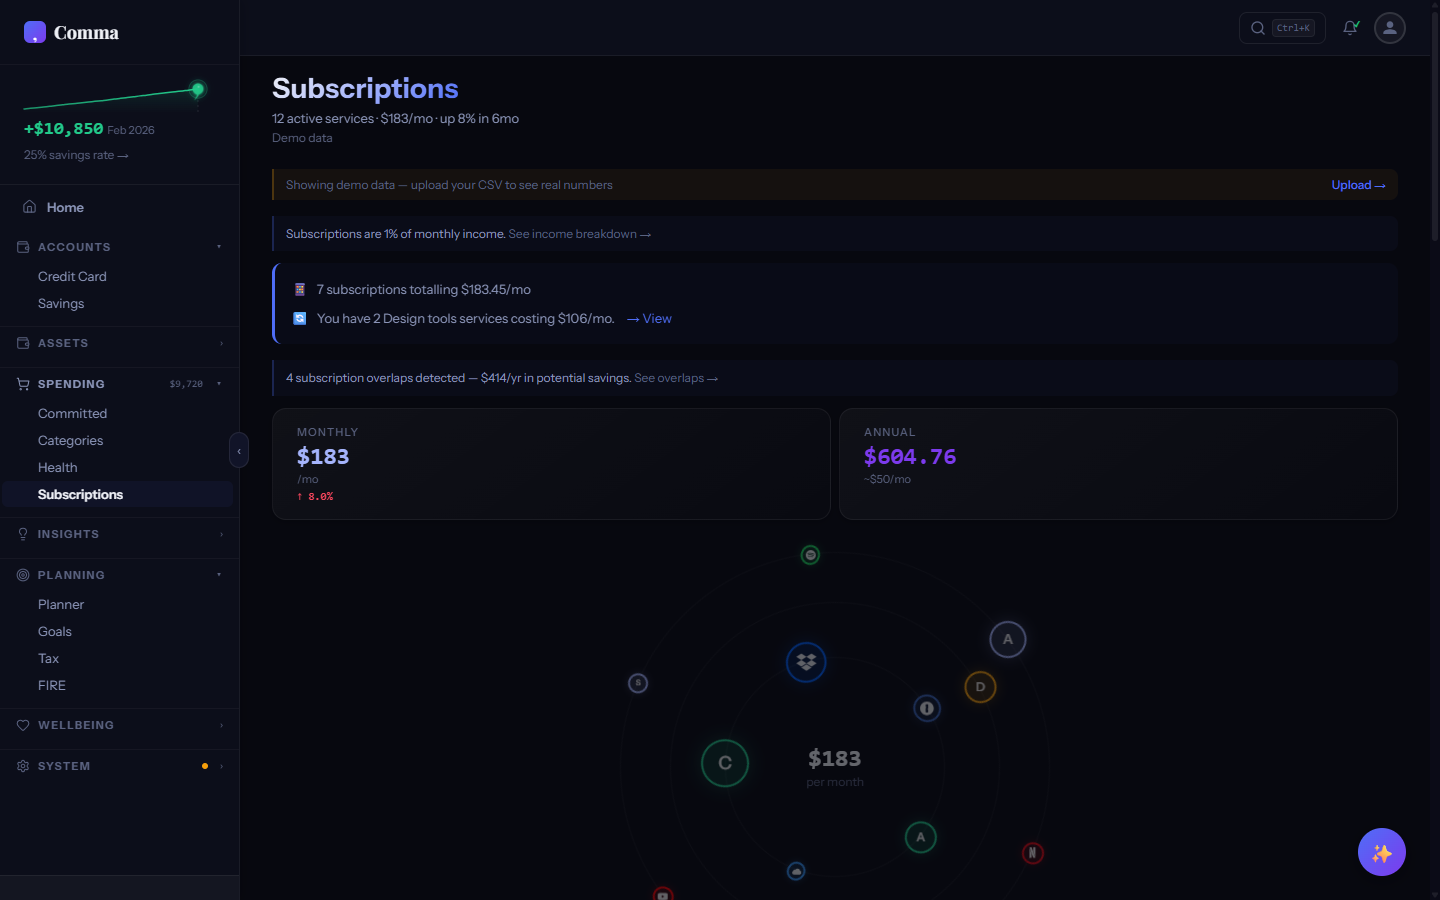
What is the Subscription Orbit?
The Subscription Orbit is a visual representation of all your active subscriptions arranged in concentric rings by billing frequency. Monthly subscriptions orbit closest to the centre, quarterly further out, and annual subscriptions on the outer ring. Each subscription is shown as a branded icon node — the visual makes it instant to see how many recurring charges you have and when they're due.
What is Subscription Drift?
Drift detection surfaces "stealth" price creep — when Netflix raises your plan from $14.99 to $18.99 over 18 months, you usually never notice on your bank statement. Each row on the Subscriptions tab shows a coloured badge inline with the merchant name when its price has moved meaningfully: • ↑ red badge for price increases ("↑ 27%") • ↓ green badge for plan downgrades ("↓ 15%") Detection requires at least 6 occurrences and 6 months of history before it fires (so a 2-month CSV upload doesn't produce noise). Comma compares the median of the first 3 amounts vs the median of the last 3 — that smooths out a one-month intro promo so a real Netflix-style discount doesn't false-trigger as drift. The badge only appears when the absolute change is ≥5%; smaller movements are treated as rounding noise. Hover the badge (or tap on mobile) to see the exact from / to figures and the months spanned.
What does the "Cancel → $X over 10yr" line mean?
Below each non-Essential subscription, Comma projects what cancelling it would compound to over 10 years if you invested the savings instead. The framing reshapes the decision — "is this worth $14.99 a month?" is easy to dismiss; "is this worth $2,486?" is much harder. Math: annualised cost (cadence-aware — a weekly $5 sub is $260/yr, not $60) invested at the end of each year for 10 years at your chosen FIRE return rate. Default rate is 8% (Balanced portfolio); if you've picked a different profile on the FIRE tab — Conservative, Aggressive, etc. — Comma uses that rate. The line only appears when the compounded number is ≥$500. A $1/month cloud-storage micro-sub compounds to about $174 over 10yr, which won't shift a real decision; cluttering the row with it would dilute the cases that matter. Essential subs (work tools, security, mental-health) deliberately don't show the line either — Comma is helping you not cancel those. Hover the line for the exact rate and horizon used.
What is Overlap Detection?
Overlap Detection identifies subscriptions that serve the same purpose — for example, paying for both Spotify and Apple Music, or both Disney+ and Stan. Comma categorises each subscription by function (music streaming, video streaming, cloud storage, etc.) and flags where you're double-paying. It suggests which one to consider cancelling based on your actual usage patterns.
What is Cost-Per-Use?
Cost-Per-Use divides each subscription's monthly cost by how often you actually use the service (estimated from transaction patterns and engagement signals). A $15/month gym membership you visit 20 times costs $0.75 per use — great value. A $12/month streaming service you haven't used in 6 weeks has an infinite cost-per-use — a cancellation candidate.
What if Comma classifies a subscription differently than I would?
Detection routes mandatory bills (phone, internet, utilities, insurance, childcare, mortgage) and pay-per-use services (Uber, Lyft, DoorDash, Deliveroo) to the Committed tab automatically — they're recurring committed costs, not subscription relationships. So your Telstra bill and your Tuesday Uber commute won't clutter Subscriptions even if their amounts happen to be flat. For everything that does land on the Subscriptions tab, the Essential / Review / Personal type chip beside each merchant is yours to control. Tap it to cycle through the three types — Comma persists your choice and the bar colour updates immediately. The override applies forever for that merchant (across devices), regardless of what the curated dictionary says. If a true one-off recurring purchase (like a weekly $5 coffee order from the same café) ends up flagged because it has a stable amount and weekly cadence, you can change its type to Personal so the visual signal reflects how you think about it.
Tax Intelligence
Five tax engines, world comparison, and relocation modelling.
What tax systems does Comma support?
Comma includes full tax engines for five countries: Australia (progressive brackets, LITO, Medicare levy, HECS-HELP, salary sacrifice, superannuation), United Kingdom (income tax bands, personal allowance, National Insurance with Scottish bands, ISA, pension relief, postgraduate loan plans), United States (federal brackets, FICA, standard deduction, 401k, HSA, Californian 9-bracket state tax + behavioural-health surcharge), Canada (federal + provincial brackets, CPP including CPP2 second additional contribution, EI, RRSP, TFSA), and New Zealand (income tax, ACC earner levy, KiwiSaver). Each engine calculates to the cent against published government examples — 274 precision tests run on every commit.
Can I see what my tax would have been in a previous (or upcoming) year?
Yes. The Tax tab shows pills for the active tax year alongside the year either side — for example AU defaults to FY2025-26 with FY2024-25 and FY2026-27 selectable; UK defaults to TY2026-27 with 2025-26 selectable; US/CA show 2025; NZ shows 2026-27. Tapping a pill recalculates everything live: bracket bands, thresholds, levies, and any year-specific changes. Useful for: • Checking how the AU Stage 3+ Phase 2 rate cut (16% → 15% from July 2026) lands on your salary in advance. • Modelling a UK Personal Allowance freeze year vs a rebase year. • Comparing CPP2 contributions in CA pre and post the 2024 reform. The year toggle and the locale selector work independently — switch locale in Settings to compare an AU 2025-26 calculation against a UK 2026-27 one in two clicks.
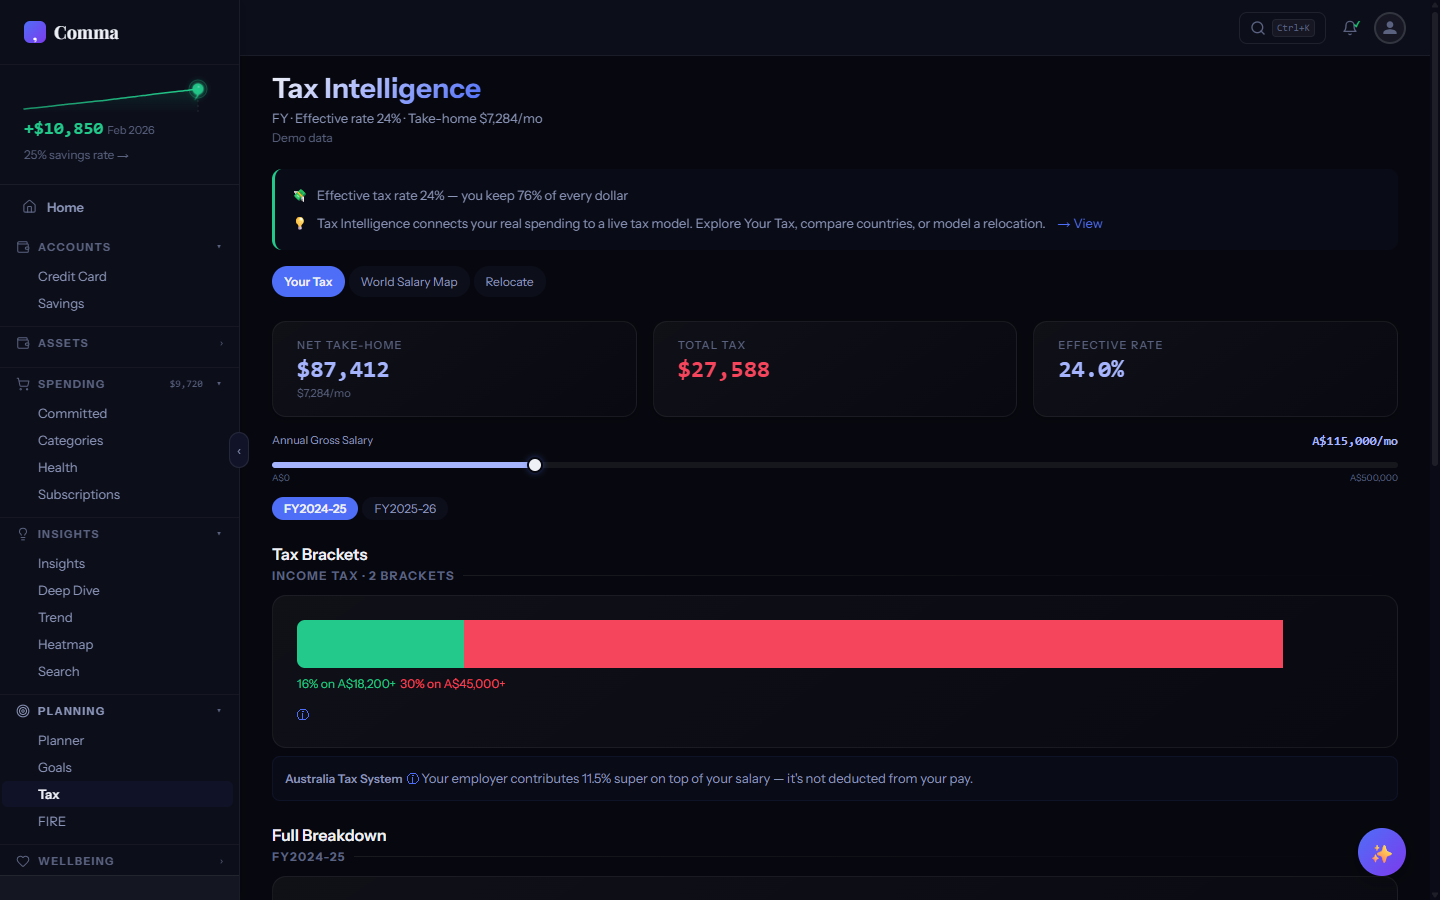
What is the bracket visualiser?
The bracket visualiser shows your income split across each tax bracket as proportional coloured segments. You can see exactly how much of your income falls in each bracket and the marginal rate applied to each portion. An info tooltip explains that your top bracket rate is not your effective rate — each bracket only applies to income within that range, not your entire salary.
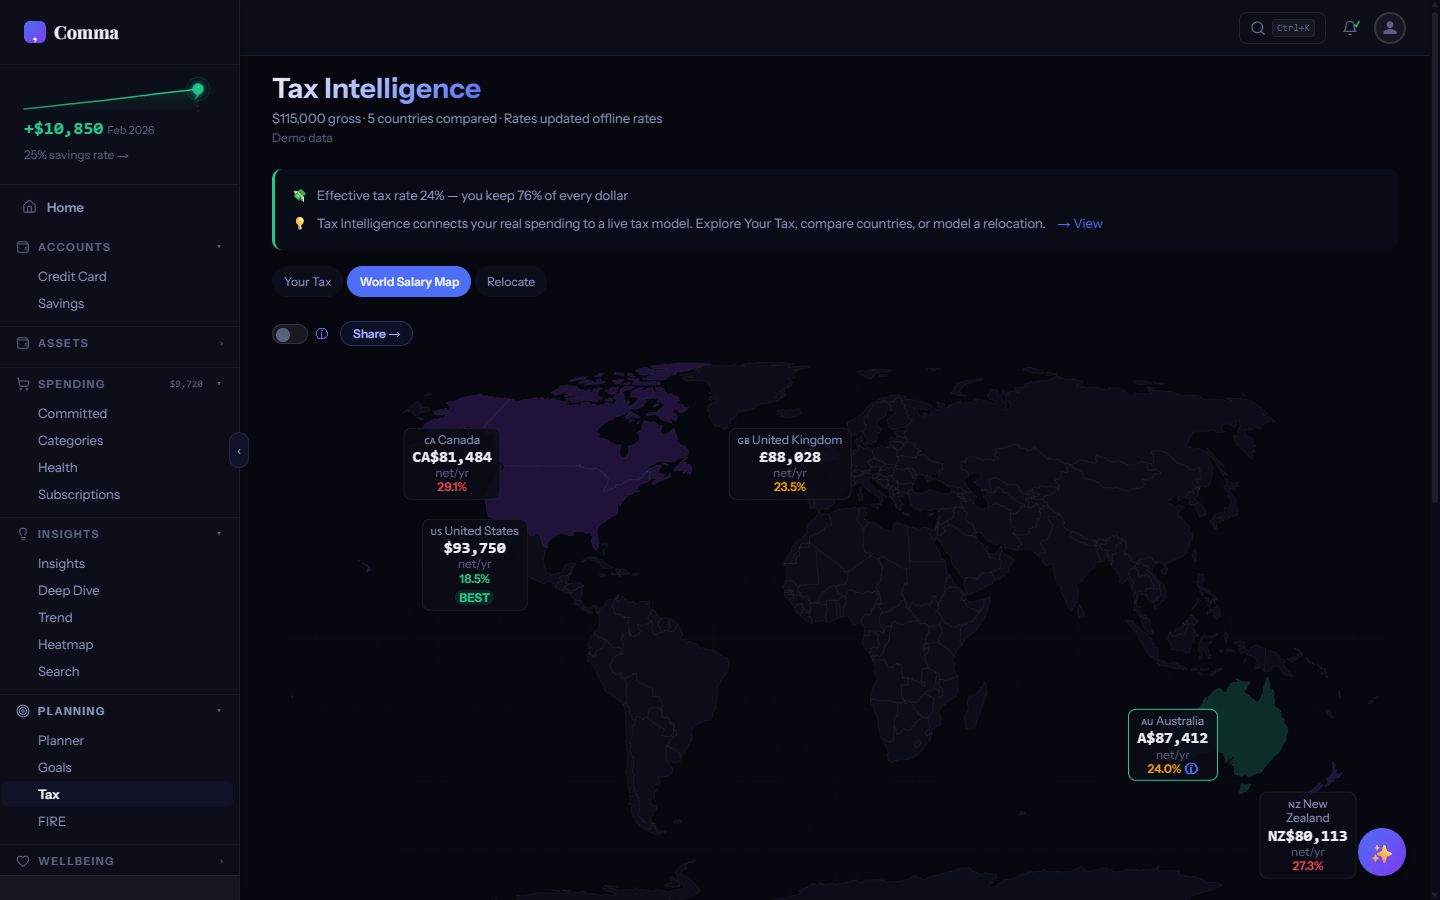
What does the World Salary Map show?
The World Salary Map compares your take-home pay across all five supported countries simultaneously. Enter your gross salary once, and Comma calculates net income, total tax, and effective rate for each country. A PPP (Purchasing Power Parity) toggle adjusts for cost-of-living differences — $100k in Sydney buys less than $100k in Wellington. The "BEST" badge highlights the country where you'd keep the most.
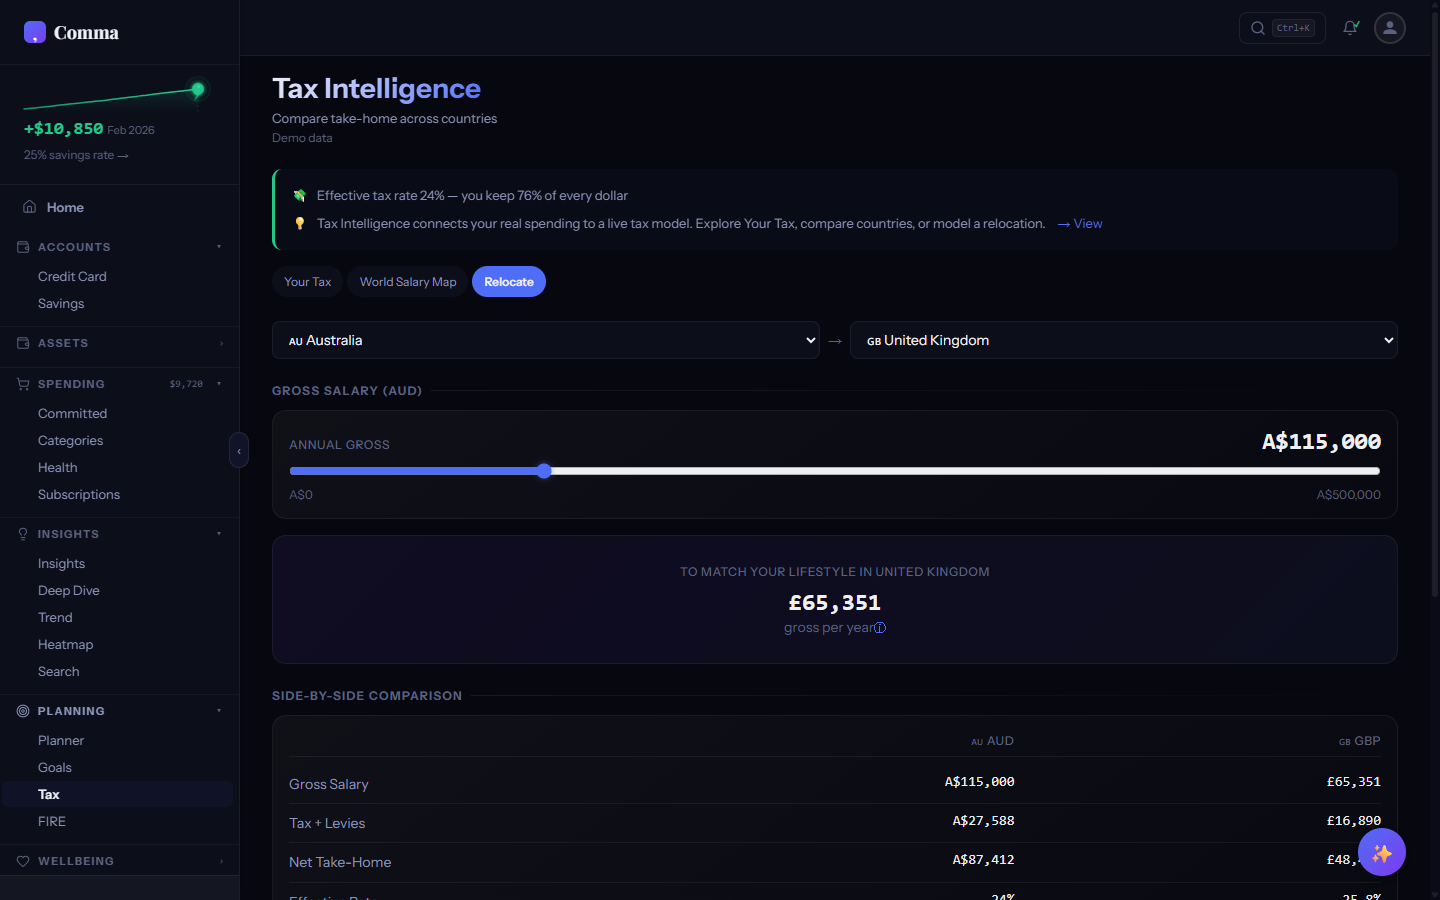
What is the Relocate solver?
The Relocate tool models moving from your current country to another. It shows side-by-side tax breakdowns for your current location and your target, including the net difference in take-home pay, equivalent gross salary needed to maintain your current lifestyle, and country-specific retirement vehicle comparisons (super vs 401k vs KiwiSaver). Useful for anyone considering an international move.
What tax planning tools are available?
Pro and Lifetime users can model salary sacrifice, pension contributions, 401(k) optimisation, HECS repayment scenarios, and deduction impacts. Each planning tool shows the before/after effect on your take-home pay and effective tax rate. These are interactive sliders — adjust contributions in real time to find your optimal tax position.
Does Comma flag potential tax deductions?
With Pro or Lifetime, Comma scans your categorised transactions for items that commonly qualify as tax deductions — work-related expenses, professional development, union fees, home office costs, and more. Flagged transactions appear with a tax icon in Categories and are summarised in the Tax tab with a one-click export for your accountant.
Is my tax data private?
All tax calculations run entirely in your browser using JavaScript. Your salary, tax breakdown, and planning scenarios are never sent to any server. The tax engines are pure functions that take a gross salary and return a calculation — no network requests, no analytics, no tracking.
Health Intelligence
Financial health scoring with locale-specific insight cards.
What is Health Intelligence?
Health Intelligence is a rule-based engine that scores your financial health across multiple dimensions — savings rate, debt ratio, spending volatility, category balance, and more. It generates insight cards that explain what each metric means for your situation, using locale-specific context (e.g. Medicare Levy Surcharge thresholds for AU, National Insurance bands for UK).
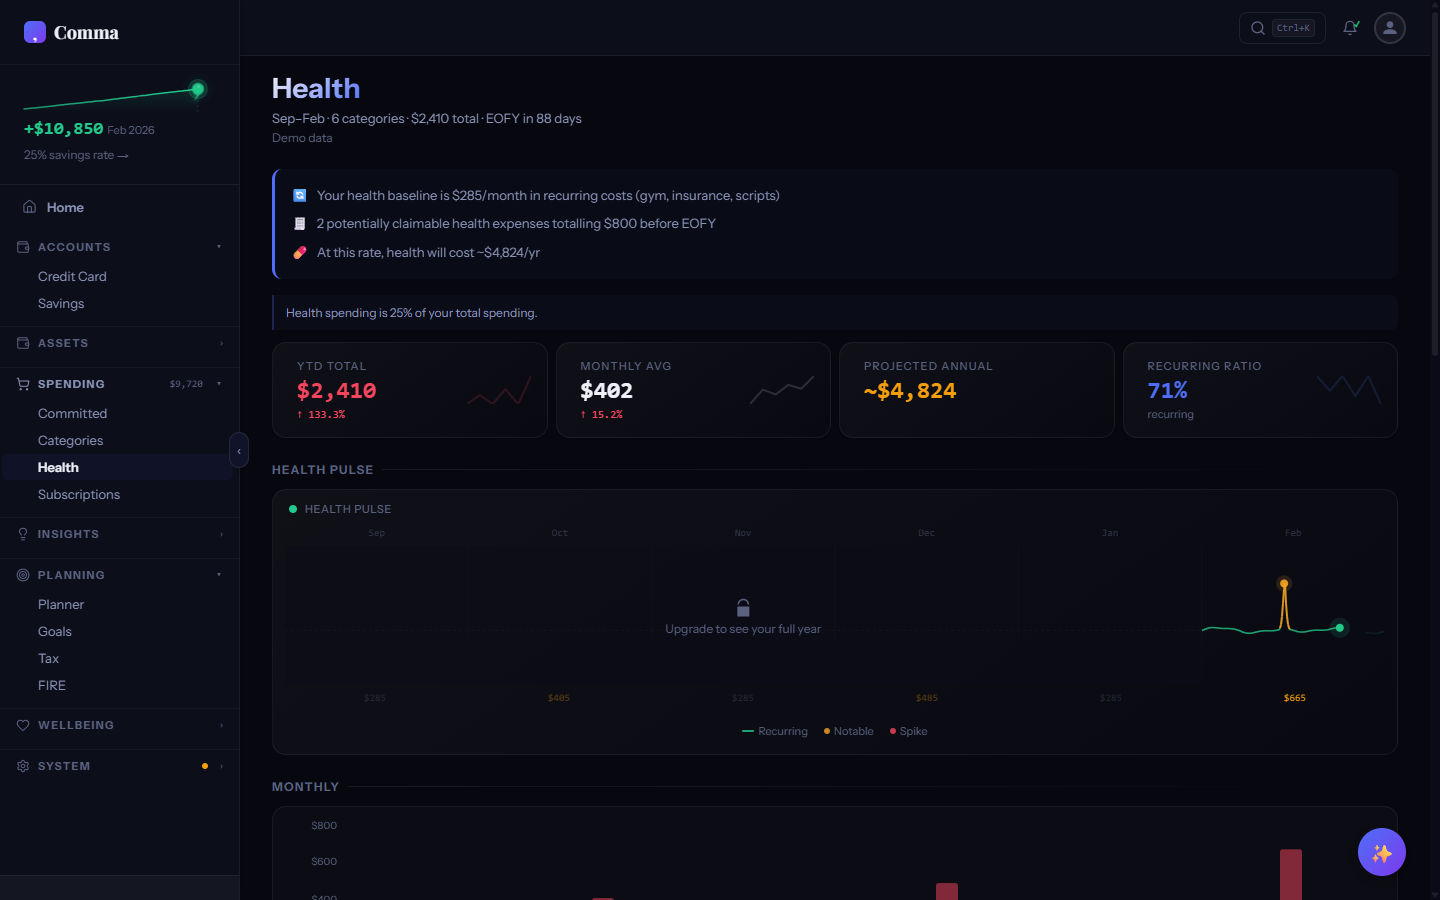
What is the ECG trace?
The ECG trace is an animated line that mimics a heartbeat monitor, visualising your financial "pulse" across health dimensions. Each peak represents a scored metric — the height and colour indicate how healthy that dimension is. Green peaks are strong areas, amber peaks need attention, and red peaks flag concerns. The animation plays on tab entry to draw your eye to the overall health pattern.
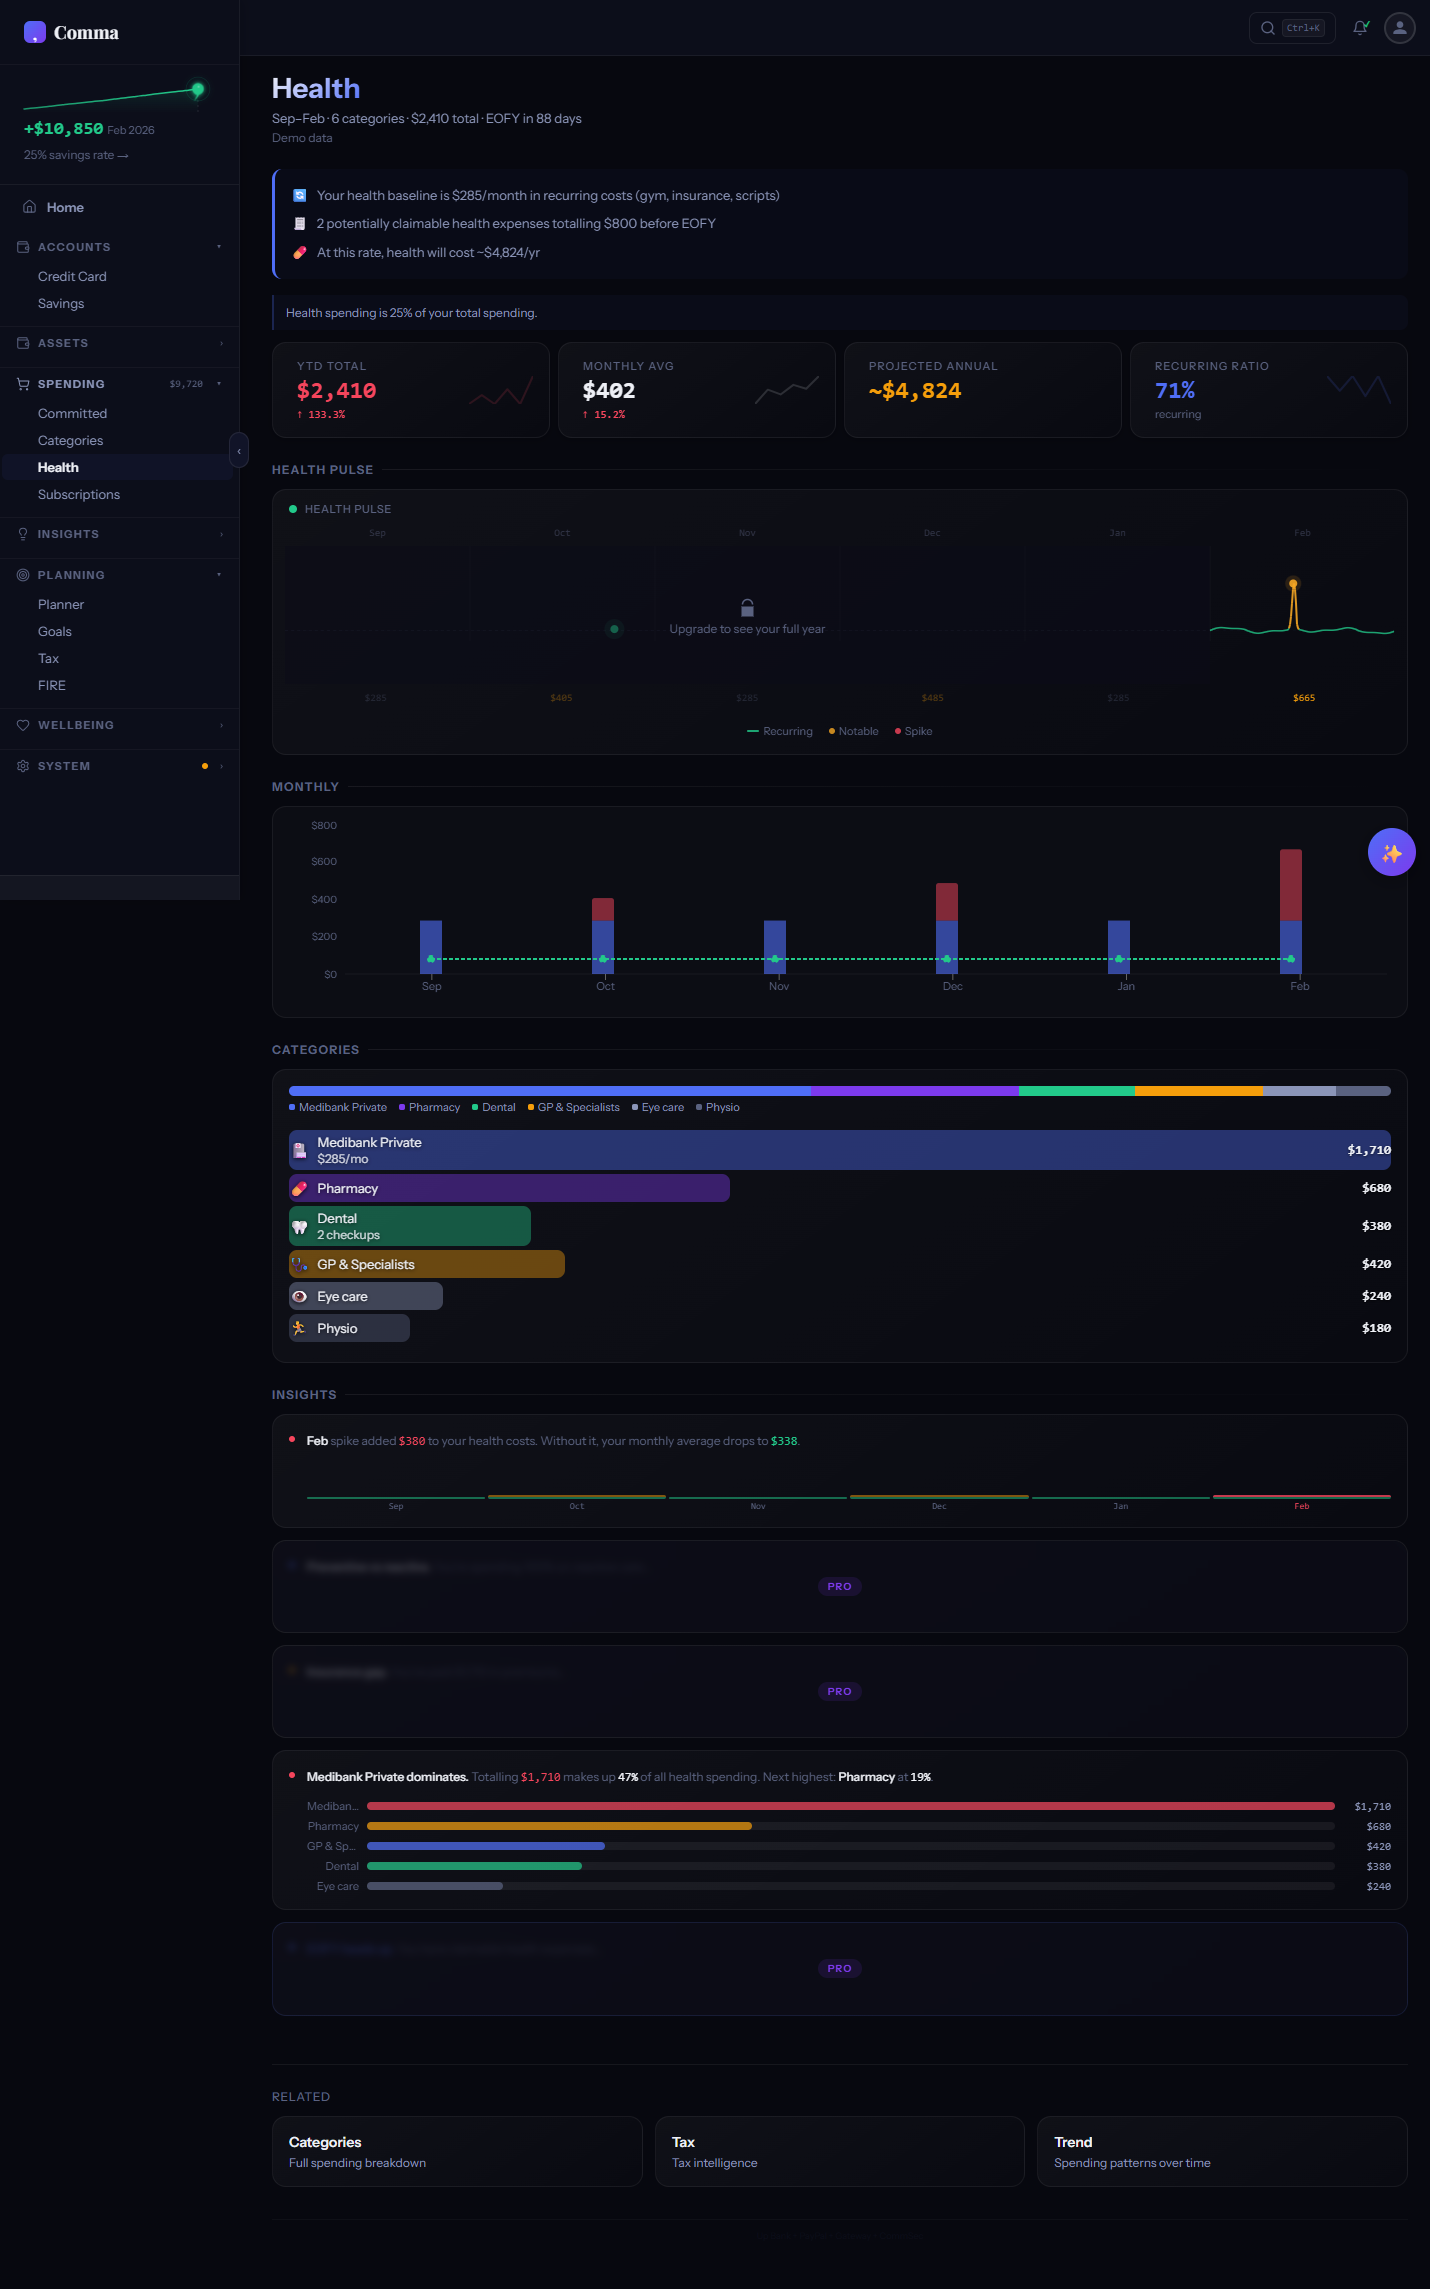
What are health insight cards?
Insight cards are contextual explanations generated by a rule-based engine (not AI) that analyse your transaction data against financial benchmarks. There are 19 card templates covering topics like emergency fund adequacy, spending-to-income ratio, subscription burden, category concentration, and savings trajectory. Each card shows a score, a plain-English explanation, and an action you can take.
Are health cards different for each country?
Comma generates 12 locale-specific card types tailored to each country's financial system. Australian users see cards about Medicare Levy Surcharge thresholds and Lifetime Health Cover loading. UK users see National Insurance band analysis. US users see HSA and 401(k) contribution guidance. Each card references local rules, thresholds, and terminology relevant to your jurisdiction.
Does Health Intelligence use AI?
No. Health Intelligence is entirely rule-based — a deterministic engine that applies financial benchmarks and thresholds to your data. Every insight card is generated by a template with specific trigger conditions, not by a language model. This means results are reproducible, explainable, and don't require sending your data to any external service.
FIRE Dashboard
Financial Independence calculator with Monte Carlo simulation.
What is the FIRE dashboard?
FIRE (Financial Independence, Retire Early) is a movement focused on saving aggressively to reach a portfolio that sustains your living expenses indefinitely. Comma's FIRE dashboard calculates when you could reach financial independence based on your current savings rate, investment returns, and spending — with four different FIRE variants to choose from.
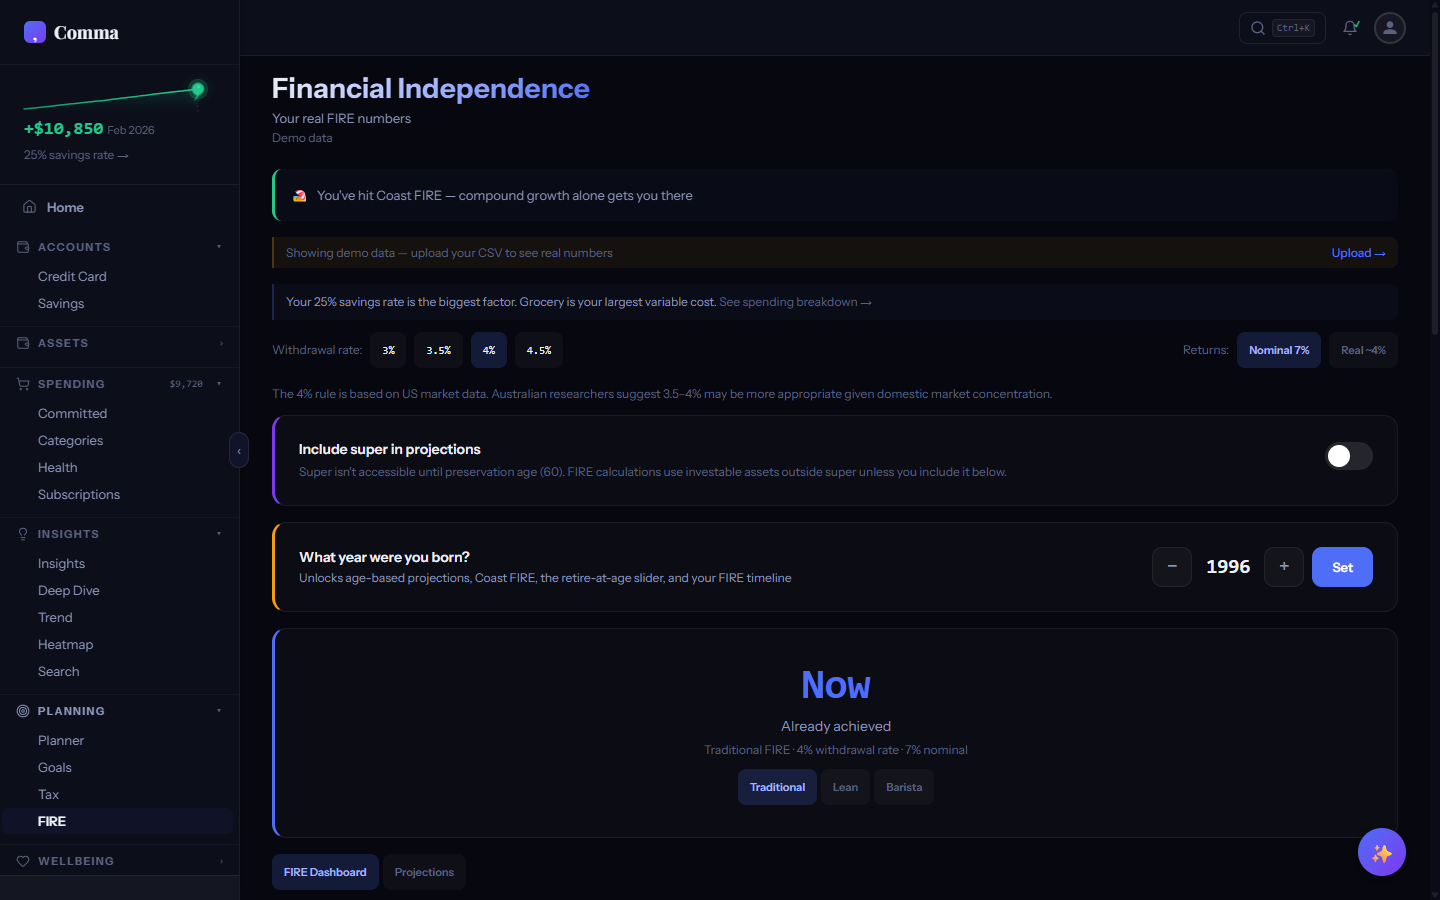
What are the four FIRE variants?
Regular FIRE: replace 100% of current spending with investment income. Lean FIRE: a frugal version targeting 60-80% of current spending. Fat FIRE: a comfortable version targeting 120-150% of spending. Coast FIRE: save enough by a certain age that compound growth alone carries you to retirement, even if you stop contributing. Each variant shows a different FI number and timeline.
What is Monte Carlo simulation?
Monte Carlo runs thousands of randomised market return scenarios to estimate the probability of your FIRE plan succeeding. Instead of assuming a fixed 7% annual return, it simulates realistic market volatility — some years up 25%, others down 15%. The result is a probability distribution: "You have a 78% chance of reaching FI by age 52." This is far more realistic than a single straight-line projection.
What is the Safe Withdrawal Rate?
The Safe Withdrawal Rate (SWR) is the percentage of your portfolio you can withdraw annually without running out of money over a 30+ year retirement. The classic "4% rule" suggests withdrawing 4% per year. Comma lets you adjust the SWR between 3% and 5% to see how it affects your FI number and timeline — a lower rate is more conservative but requires a larger portfolio.
Does FIRE account for inflation?
An inflation toggle adjusts all projections to show values in today's purchasing power. With inflation on, your FI number is higher (because future dollars buy less) and your timeline extends. With it off, you see nominal values. The toggle helps you understand the real cost of financial independence versus the headline number.
Does FIRE account for my country's retirement system?
FIRE projections include locale-specific retirement vehicles: Australian superannuation (11.5% employer contribution, preservation age), UK workplace pension (auto-enrolment, state pension age), US 401(k) (employer match, contribution limits), Canadian RRSP, and NZ KiwiSaver. These are factored into your Coast FIRE calculation and overall FI timeline.
Gambling Tracker
Net position tracking, session reconstruction, and harm reduction.
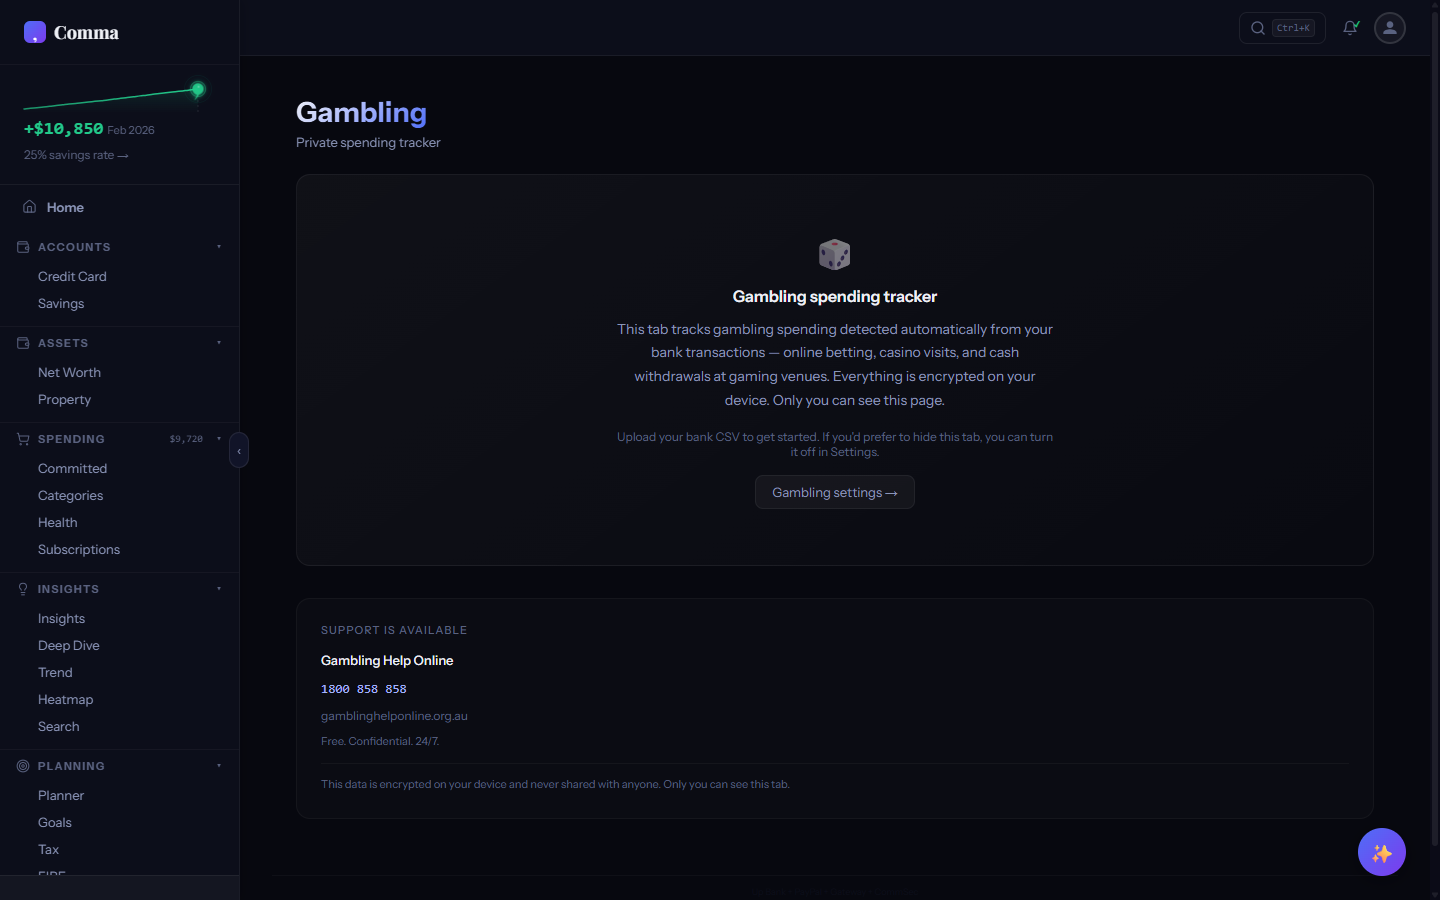
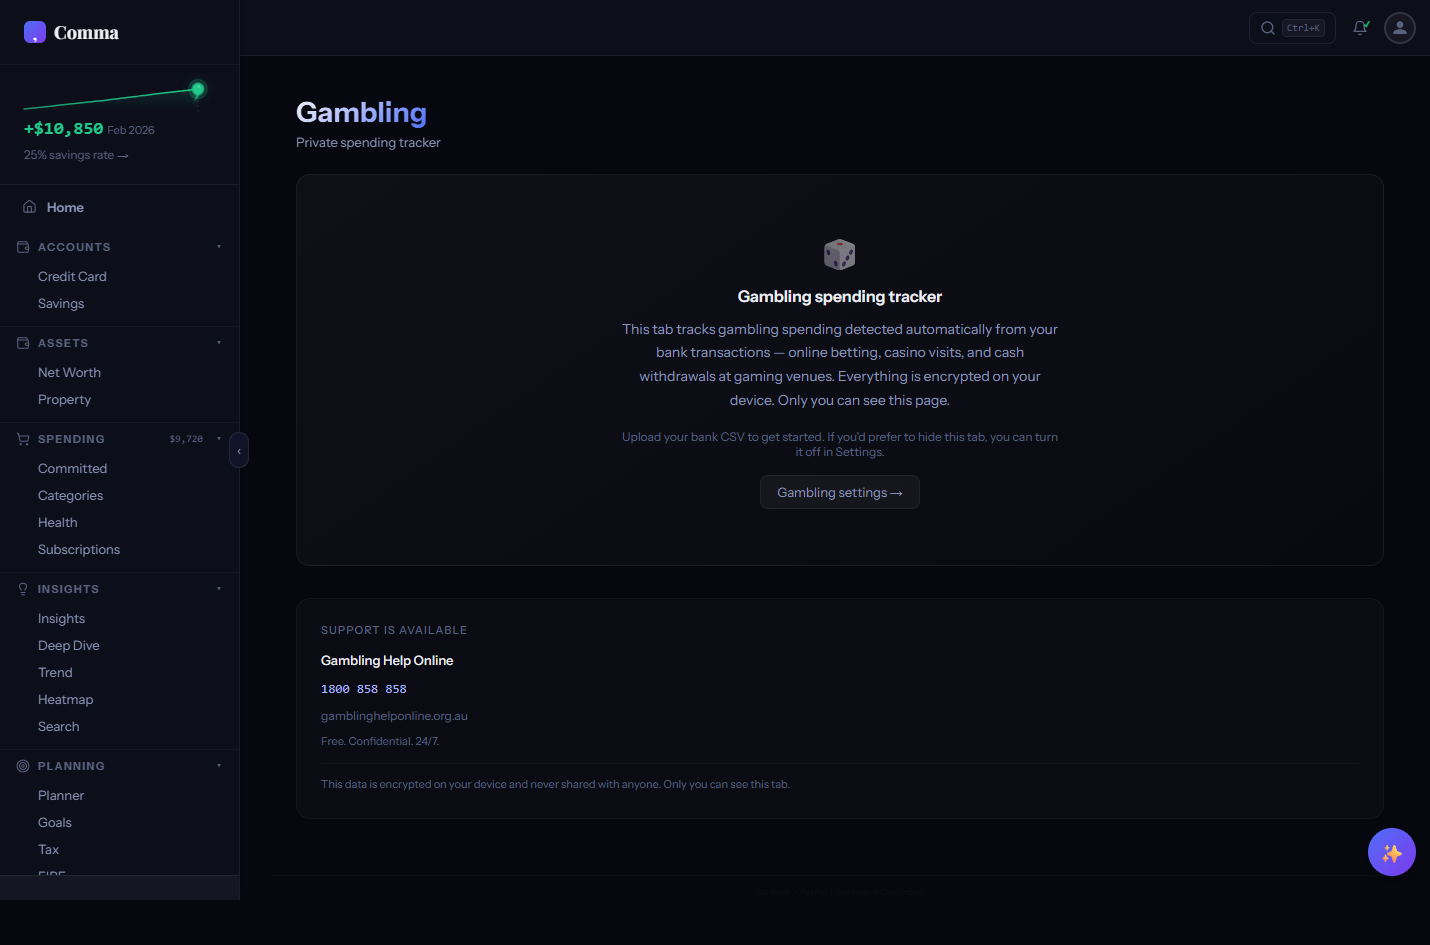
What is the Gambling Tracker?
The Gambling Tracker analyses your transaction history to surface gambling-related spending in a dedicated, judgement-free dashboard. It shows your net gambling position (total deposits minus withdrawals), reconstructs individual sessions, detects chasing behaviour, and provides a calendar heatmap of gambling frequency. The feature is opt-in, hidden by default, and completely free — no tier gating.
What is my net gambling position?
Your net position is the total of all deposits to gambling merchants minus all withdrawals (winnings). Comma auto-detects gambling transactions from merchant patterns (TAB, Sportsbet, Ladbrokes, PokerStars, etc.) across all supported banks. The number is presented clearly as a cumulative total — most people are surprised by the figure when they see all gambling spending aggregated.
How does session reconstruction work?
Comma groups gambling transactions into sessions based on timing — deposits and withdrawals that occur within a short window are clustered into a single "session." Each session shows deposits in, withdrawals out, net result, and duration. This reveals patterns like session length increasing over time or losses triggering immediate follow-up deposits.
What is chase detection?
Chase detection identifies patterns where a losing session is immediately followed by another deposit — a common behaviour in problem gambling. Comma flags these "chase events" on the session timeline and tracks their frequency over time. This is a data-driven observation, not a judgement — the goal is awareness.
What does the calendar heatmap show?
The gambling calendar heatmap shows frequency and intensity of gambling activity by day, similar to GitHub's contribution graph. Darker cells mean higher spending that day. The visual makes patterns obvious — you can instantly see if gambling clusters on weekends, payday, or during specific periods.
What is the Real-Cost Ticker?
The Real-Cost Ticker converts your net gambling losses into tangible equivalents — for example, "Your losses would have covered 14 months of Netflix" or "equivalent to 3 return flights to Bali." The ticker scrolls through different comparisons to put the abstract dollar figure into concrete perspective.
Can anyone see my gambling data?
Gambling data receives the same encryption as all other Comma data — AES-256-GCM with your password as the key. The Gambling tab is opt-in (enabled via Settings) and doesn't appear in the sidebar unless you choose to show it. No gambling data is ever transmitted, analysed externally, or visible to anyone but you.
Where can I get help with gambling?
The Gambling Tracker includes helpline numbers for every supported country directly in the tab: Gambling Help Online (AU: 1800 858 858), GamCare (UK: 0808 802 0133), NCPG Helpline (US: 1-800-522-4700), Gambling Helpline (NZ: 0800 654 655), and the Responsible Gambling Council national directory (CA: responsiblegambling.org). These are always visible at the bottom of the Gambling tab.
Interactive Planner
Sankey flow diagram with slider-based budget planning.
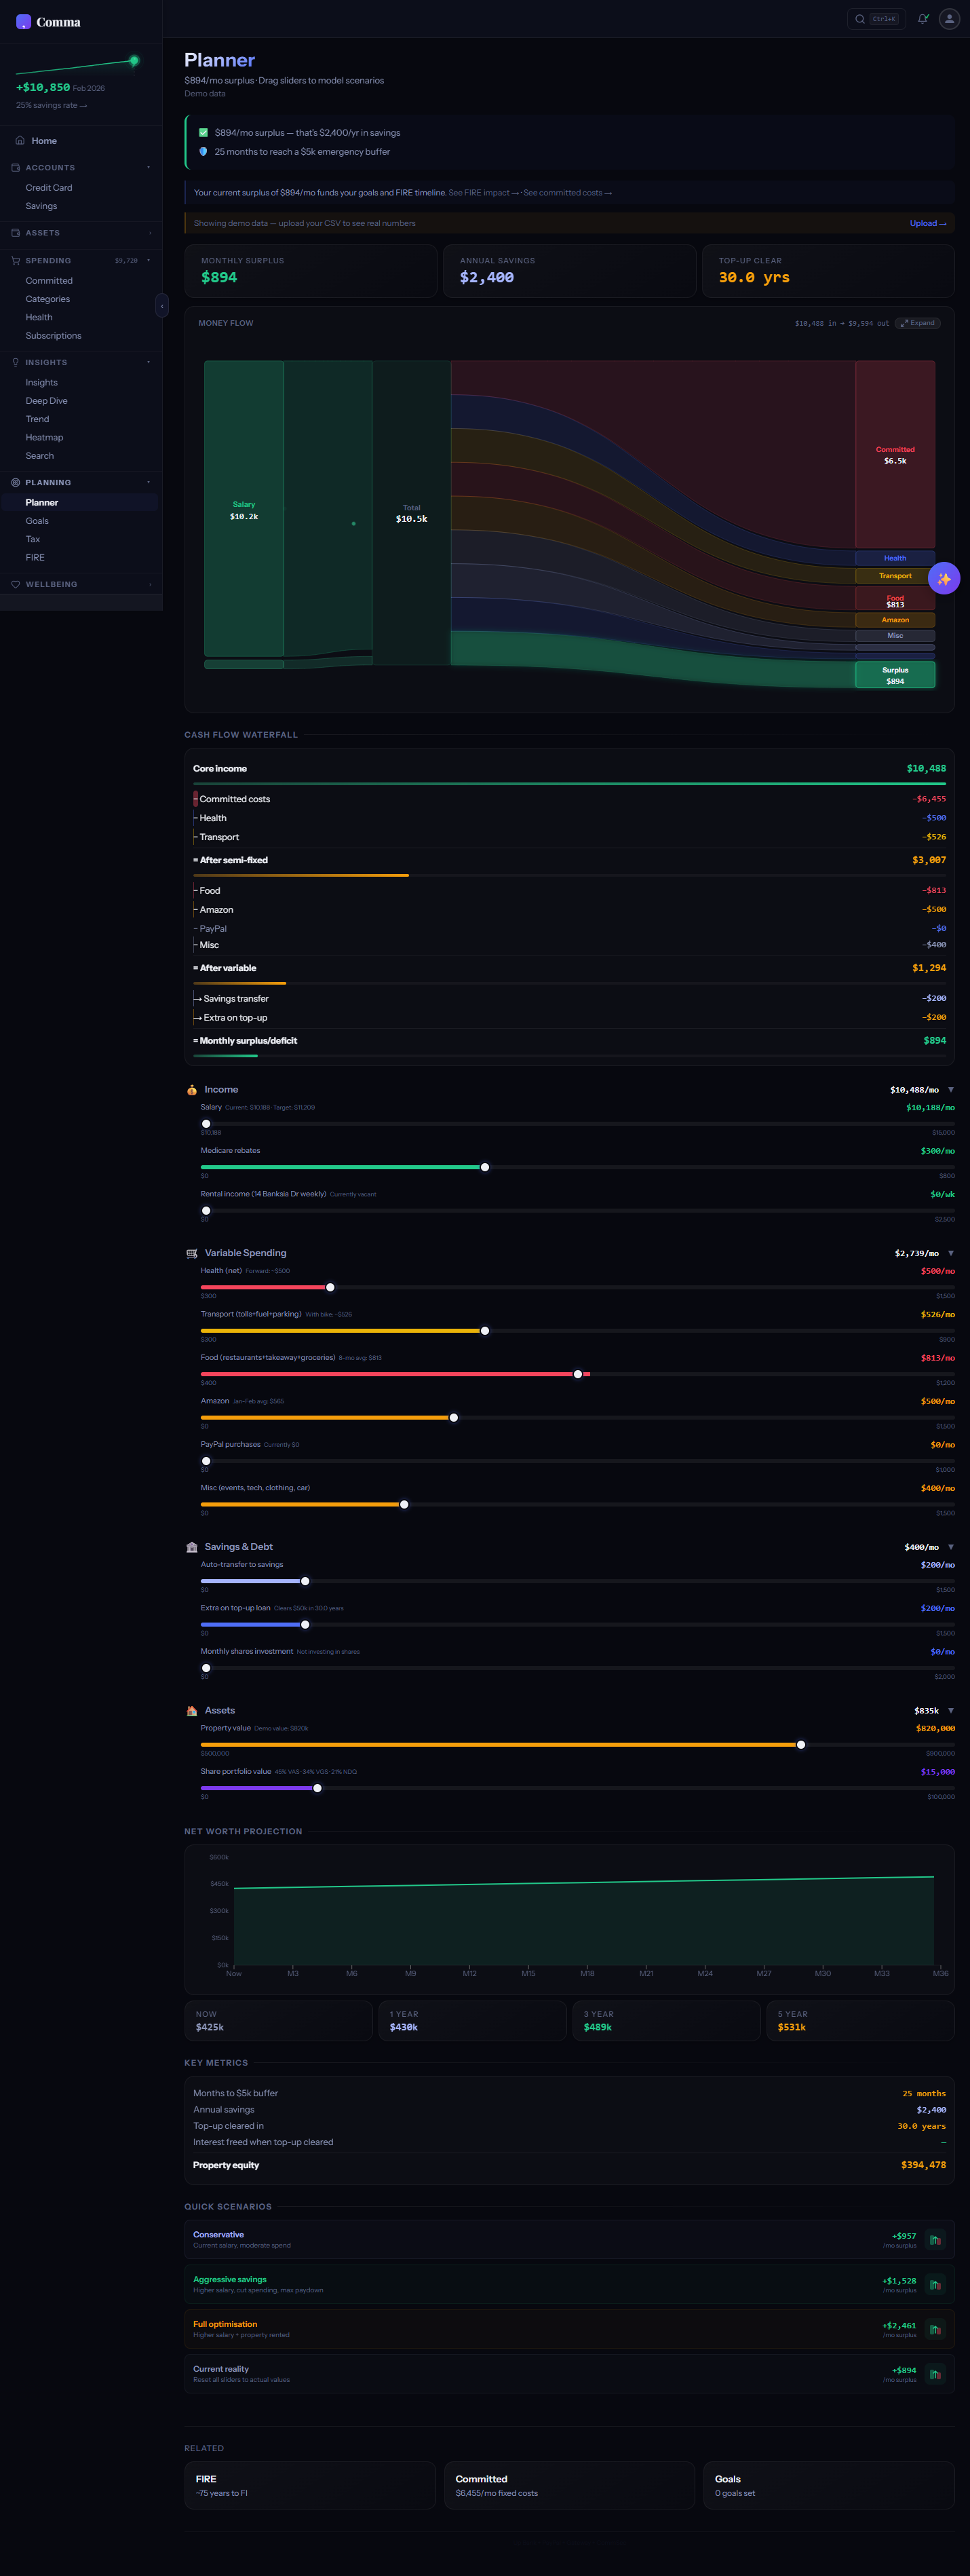
What is the Interactive Planner?
The Planner visualises your monthly money flow as a Sankey diagram — income flows in from the left, splits into committed expenses, variable spending, and savings, then flows out to specific categories on the right. Sliders let you adjust each category in real time and see how changes affect your surplus or deficit instantly.
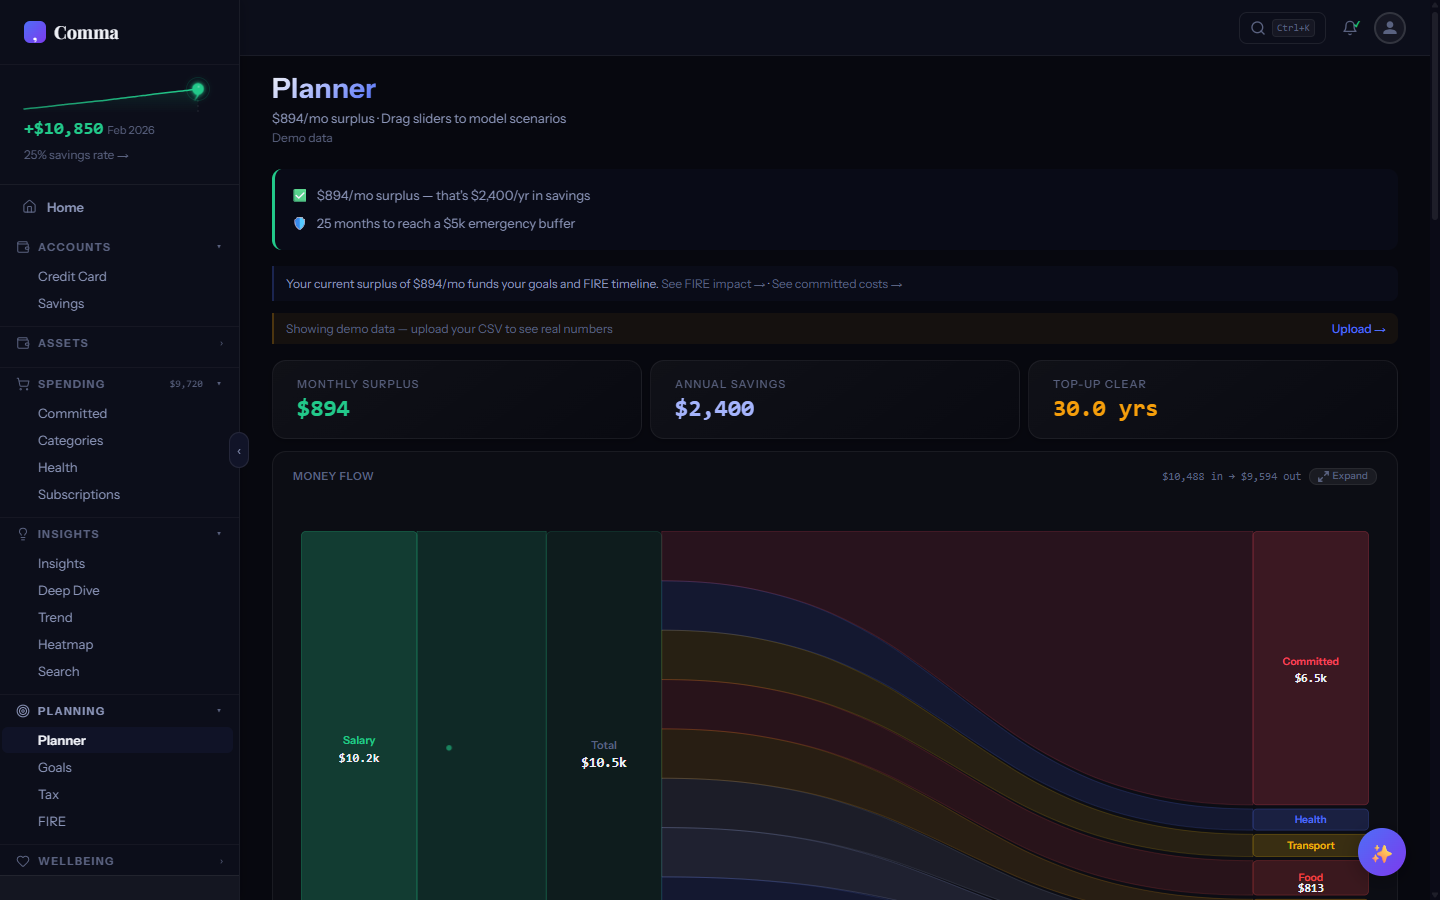
How do I read the Sankey diagram?
The width of each flow band is proportional to the dollar amount. Your total income enters on the left as a single wide band. It then splits into committed costs (rent, utilities, insurance), variable spending (groceries, dining, transport), and surplus (savings). The thicker a band, the more money flows there. Green flows indicate savings, amber flows are variable spending, and the overall balance is clear at a glance.
How do the sliders work?
Each spending category has a slider that adjusts the planned monthly amount. When you have uploaded data, sliders are seeded with your actual average spending in each category. Drag any slider to model "what if" scenarios — reducing dining from $400 to $200 instantly updates the Sankey, waterfall chart, and surplus projection.
What are scenario cards?
Scenario cards are pre-built "what if" adjustments — like "Cut subscriptions by 50%" or "Increase income by $500." Tapping a scenario card applies the adjustments to your sliders and shows the before/after impact on your monthly surplus. You can stack multiple scenarios to model complex budget changes.
What are the waterfall bars?
The waterfall chart below the Sankey shows each category as a bar stepping down from your total income — like a staircase descending from gross income to net surplus. Green bars are positive (income), red bars are deductions (spending), and the final bar shows what remains. It's a different way to see the same data as the Sankey — some people find the waterfall more intuitive for understanding where money goes.
Goals & Confidence Rings
Savings goals with dual progress/confidence ring visualisation.
What are the dual confidence rings?
Each goal displays two concentric rings. The inner ring shows actual progress — how much you've saved toward the target (e.g. $12,000 of $60,000 = 20%). The outer ring shows confidence — the statistical probability of reaching the goal by your target date based on your current savings trajectory. A goal might be only 20% funded but have 85% confidence if you're saving fast enough.
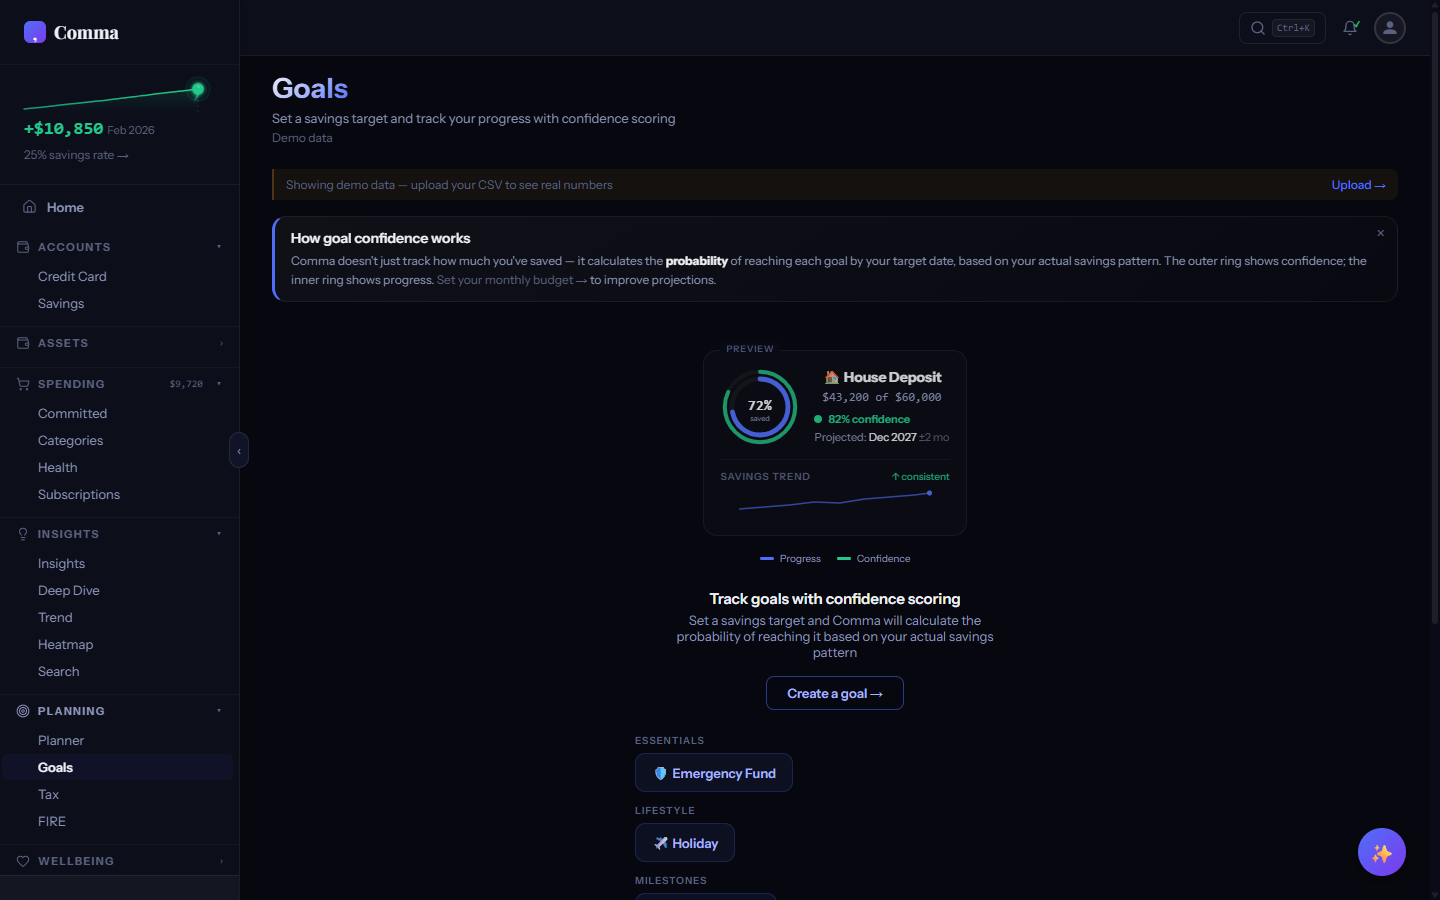
How is confidence calculated?
Confidence uses a CDF (Cumulative Distribution Function) that models the probability of reaching your goal by the target date given your actual savings rate, its variance month-to-month, and time remaining. High variance (inconsistent savings) lowers confidence even if your average rate is on track. The calculation runs on every data update so the probability adjusts as your behaviour changes.
What do the ring colours mean?
Green (>70% confidence): you're on track — current trajectory is likely to hit the target. Amber (40-70%): achievable but at risk — savings may need to increase or timeline extend. Red (<40%): unlikely at current rate — consider adjusting the target amount, timeline, or monthly contribution. The colours update dynamically as you save and as time passes.
How do I add a goal?
Click "Add goal" on the Goals tab. Give it a name, emoji, target amount, and target date. You can optionally link it to a savings account so progress tracks automatically from your uploaded bank data. Comma includes goal templates for common targets — house deposit, emergency fund, holiday, car — with suggested amounts based on your locale.
What goal templates are available?
Templates provide pre-configured goals with locale-appropriate amounts and timelines. Examples include House Deposit ($60,000 AUD / $50,000 USD), Emergency Fund (3-6 months of expenses calculated from your data), Holiday Fund, New Car, Wedding, and Education. Each template seeds the goal form with a suggested emoji, amount, and timeframe you can customise.
Can I see a projection of when I'll reach my goal?
Pro and Lifetime users see a projection chart on each goal showing the expected savings trajectory over time — a solid line for actual progress and a dashed line for the projected path. The projection accounts for your savings rate variance, not just the average, so the confidence band widens over longer time horizons.
Net Worth & Landscape
Balance sheet tracking with generative terrain visualisation.
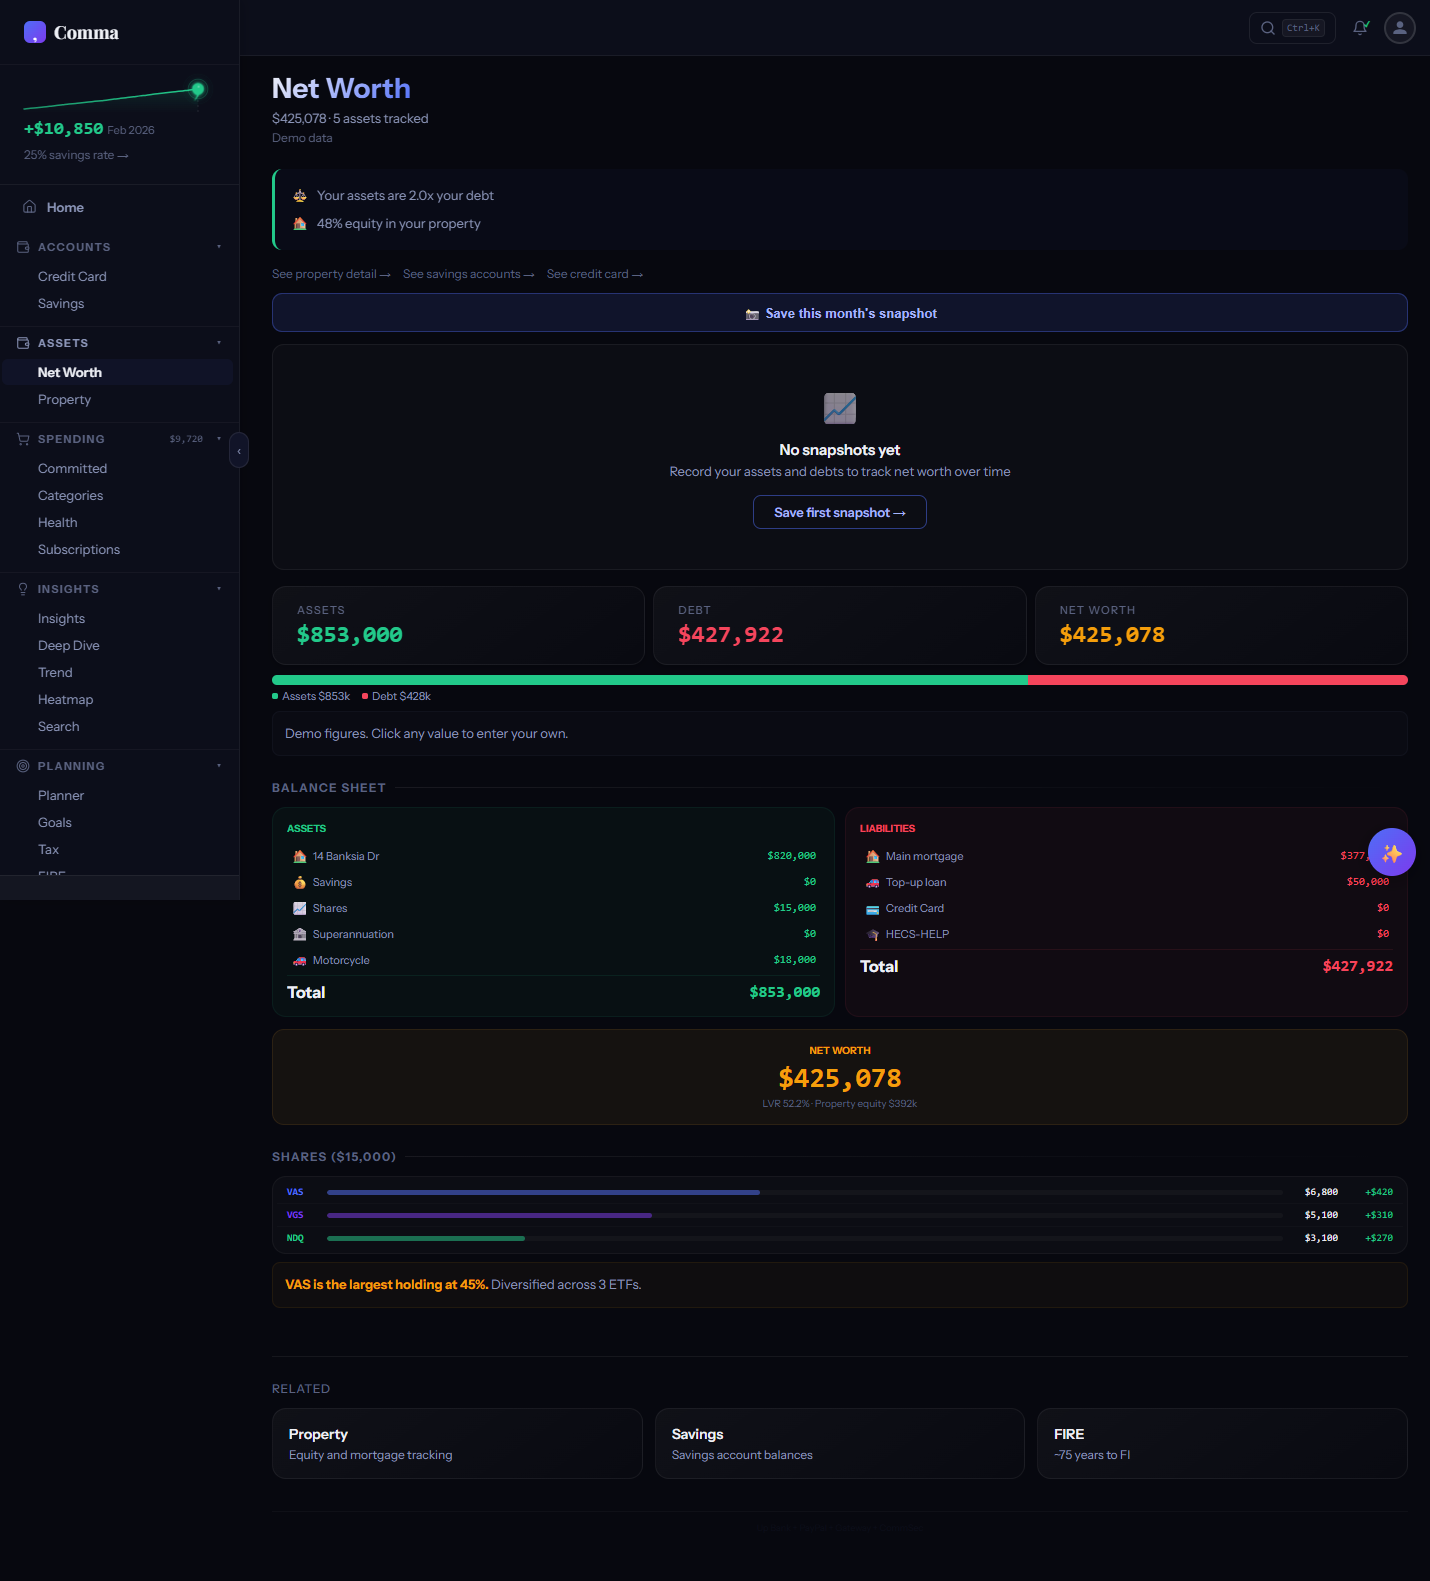
What does the Net Worth tab show?
The Net Worth tab is your personal balance sheet — assets minus liabilities equals net worth. It tracks property, shares/investments, superannuation/retirement accounts, savings, vehicles, and other assets against mortgages, loans, credit cards, and other debts. You can save monthly snapshots to build a timeline of your wealth trajectory.
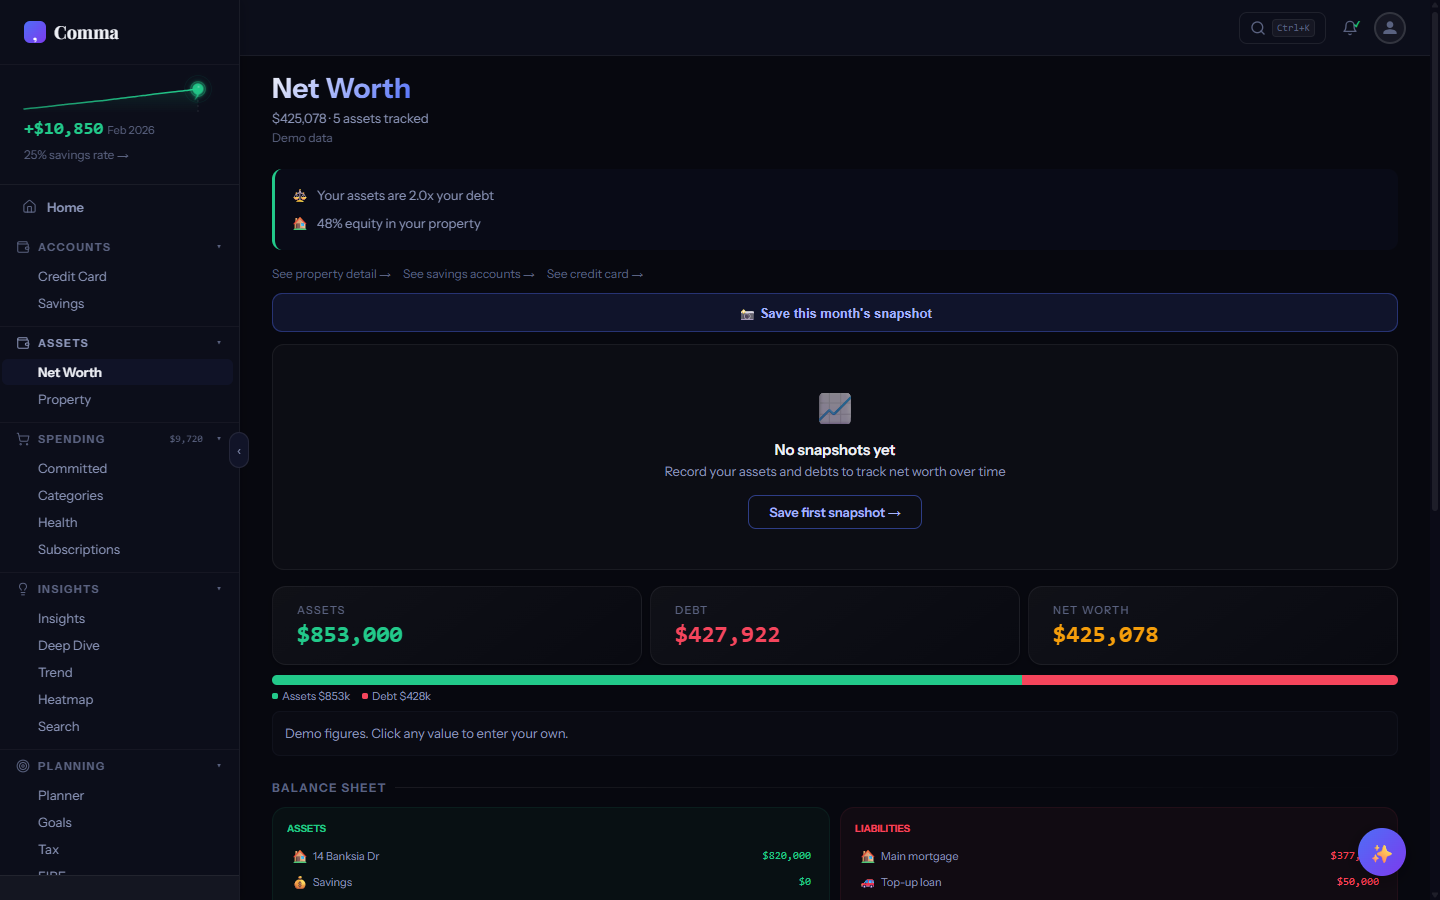
What are net worth snapshots?
A snapshot captures your total assets, liabilities, and net worth at a point in time. Save one each month to build a timeline chart showing how your wealth grows (or shrinks) over time. Free users can store 1 snapshot; Pro and Lifetime users get an unlimited timeline with a trend chart.
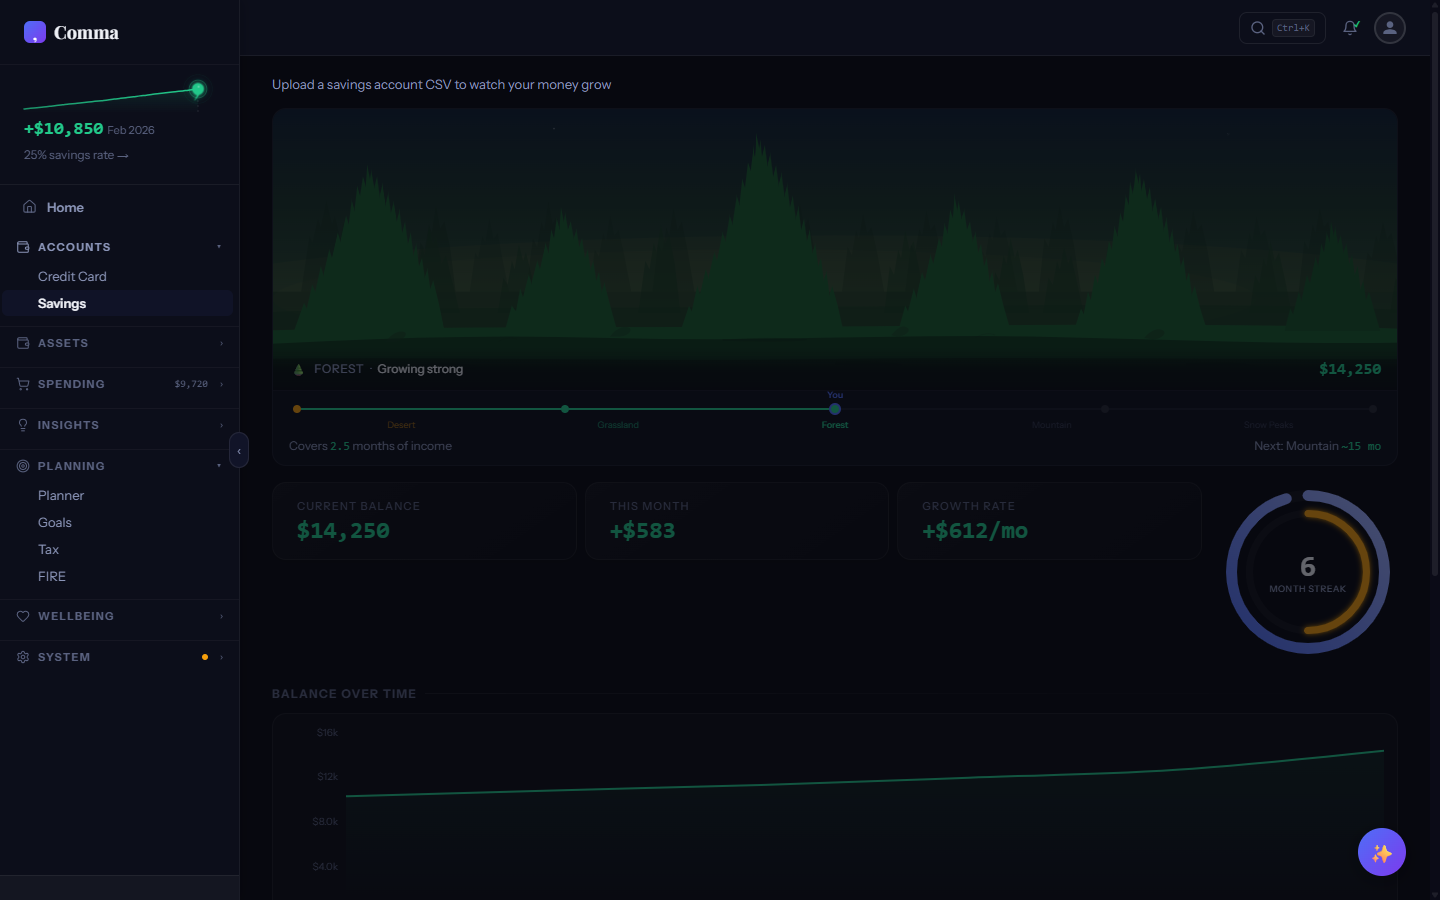
What is the GrowingLandscape?
The GrowingLandscape is a generative terrain visualisation at the bottom of the Net Worth tab that evolves based on your savings level. It renders one of five biomes: Desert (very low savings), Grassland (below average), Forest (average), Mountain (above average), and Peaks (excellent). The thresholds are income-based so they adjust to your personal situation. Each biome has ambient animations — swaying trees, drifting clouds, or falling snow.
What account types can I track?
Comma supports 8 account types for net worth: Property (home, investment properties), Shares/Investments (brokerage accounts), Super/Retirement (401k, pension, KiwiSaver), Savings (bank accounts), Vehicles, Other Assets, Mortgages/Loans, and Credit Card Debt. Each type has its own input field on the balance sheet.
How are landscape biome thresholds determined?
Biome thresholds are calculated relative to your annual income, not absolute dollar amounts. This means someone earning $60,000 with $30,000 saved sees the same biome as someone earning $200,000 with $100,000 saved — both have roughly 6 months of income saved. The thresholds account for locale-specific cost-of-living benchmarks.
Multi-Account
Import from multiple banks with transfer detection.
Can I import from multiple banks?
Drag and drop CSVs from as many banks and accounts as you want, or click Upload CSV in the All Accounts tab. Comma auto-detects the bank format for each file independently. Your credit card CSV from CBA, savings account from Up Bank, and PayPal export can all coexist. Each file is tagged with its detected bank format and stored separately.
How does Comma handle transfers between my own accounts?
When you upload CSVs from multiple accounts, Comma's transfer detection engine identifies matching inflows and outflows that represent internal transfers — like moving $500 from your savings to your credit card. Detected transfers are flagged and excluded from spending totals so they don't inflate your expenses. The algorithm matches on amount, date proximity, and merchant patterns.
How is double-counting prevented?
Comma hashes every transaction by date, amount, and description. Re-uploading the same file, a renamed copy, or an overlapping statement triggers automatic dedup — only genuinely new transactions are added. For cross-account transfers, Comma's transfer detection pairs matching inflows and outflows and counts them once.
What's the All Accounts tab for?
The All Accounts tab is your account management hub — the first item in the ACCOUNTS sidebar group. It shows every account, its current balance, staleness (how recently you uploaded), and any data gaps. Expand an account to see its full import history with dates, transaction counts, and an Undo button for each import. You can also merge accounts, rename them, or delete them entirely from here.
What is the upload preview modal?
When you drop or select a CSV, Comma shows a preview before importing anything. It displays the detected bank, account type, and the first 10 transaction rows, along with a count of how many transactions are genuinely new versus how many are duplicates that will be skipped. Nothing is written until you click Confirm — so you can always review and cancel if something looks wrong.
What happens if I upload the same file twice?
Nothing bad. Comma hashes every transaction by date, amount, and description. If you upload the same CSV again — even renamed or from a different folder — Comma recognises every row as a duplicate and skips them all. The preview modal shows "0 new, X skipped" so you can see exactly what happened before confirming.
My new statement overlaps with my last upload. Do I need to crop it first?
No. Upload the full file as-is. Comma's hash-based dedup compares every row against your existing transactions and keeps only the genuinely new ones. Overlapping rows are skipped automatically. This means you can download your bank's default 90-day export every month without worrying about date ranges.
Can I see a history of every file I've uploaded?
Yes. Go to the All Accounts tab, expand any account, and you'll see the full import history — each upload listed with its date, file name, transaction count, and an Undo button. This gives you a clear audit trail of exactly when and what you imported.
I uploaded the wrong file. How do I undo it?
Go to the All Accounts tab, expand the account, find the import in the history list, and click Undo. Only that specific import's transactions are removed — everything else stays untouched. This is safer than deleting the whole account.
What does the "Missing data" warning mean?
Comma detects gaps between the earliest and latest transaction dates for each account. If your CBA data covers January to March and then jumps to June, Comma flags the April-May gap as missing data. The fix is simple — download and upload the missing statement from your bank to fill the gap.
Can I merge two accounts into one?
Yes. In the All Accounts tab, expand the account you want to merge, then click "Merge into" and choose the target account. All transactions move to the target, and dedup runs automatically to prevent duplicates. This is useful when you accidentally created two accounts for the same bank, or when a bank changes its CSV format.
Can I set the account type and nickname before importing?
Yes. After dropping a CSV, the upload confirmation modal lets you override the account type (Transaction, Credit Card, Savings, Other) and set a nickname before anything is committed. If you already have the account, the same picker is available inline — expand any account card in All Accounts and click the type badge or name to edit them in place.
What do the coloured dots on my accounts mean?
Each account card shows a staleness dot that tells you how recently you uploaded data. Green means your data is current (uploaded within the last 2 weeks). Amber means it's getting stale (2–6 weeks). Red means the account hasn't been refreshed in over 6 weeks and the data may no longer reflect your real balance. The dot is also surfaced in the Your Briefing panel on the dashboard when one or more accounts go amber or red.
How do I filter accounts by type?
The All Accounts tab has filter chips at the top — Transaction, Credit Card, Savings, and Other. Tapping a chip narrows the list to accounts of that type. Tapping the active chip again clears the filter and shows all accounts. This is useful when you have many accounts and want to quickly check, for example, all your savings accounts at once.
Why won't Comma accept my PDF statement?
Comma only accepts CSV files. PDFs are designed for printing, not structured data — every bank formats them differently, making reliable parsing impossible. If you drop a PDF or XLSX file, Comma rejects it with a message explaining why and linking to the bank export guides, which show you how to download a CSV from your bank instead.
What happens if Comma can't auto-detect my bank's CSV?
When auto-detect fails (rare — it covers 56+ formats — but happens with non-standard exports or banks not yet on the list), the file lands in an "Upload issues" section on the All Accounts tab with a "Tap to map columns" affordance. Tap it to open the Column Mapping flow. You'll see the first few rows of your CSV with dropdowns above each column. Pick which one is Date, Amount, and Description (Balance and Category are optional). A live preview at the bottom shows how Comma will parse your transactions with the current mapping. Your mapping is saved by header-row hash so you only do it once per bank format — every future upload from the same bank uses the saved mapping automatically. You can also tap "Help us support your bank automatically" inside the mapping screen to submit the format so it joins the auto-detect list in a future release.
My bank gives me an Excel file, not a CSV.
Open the Excel file (.xlsx or .xls), go to File > Save As, and choose "CSV (Comma delimited)" as the format. Save it, then upload the resulting .csv file to Comma. If the spreadsheet has multiple sheets, save the one containing your transactions.
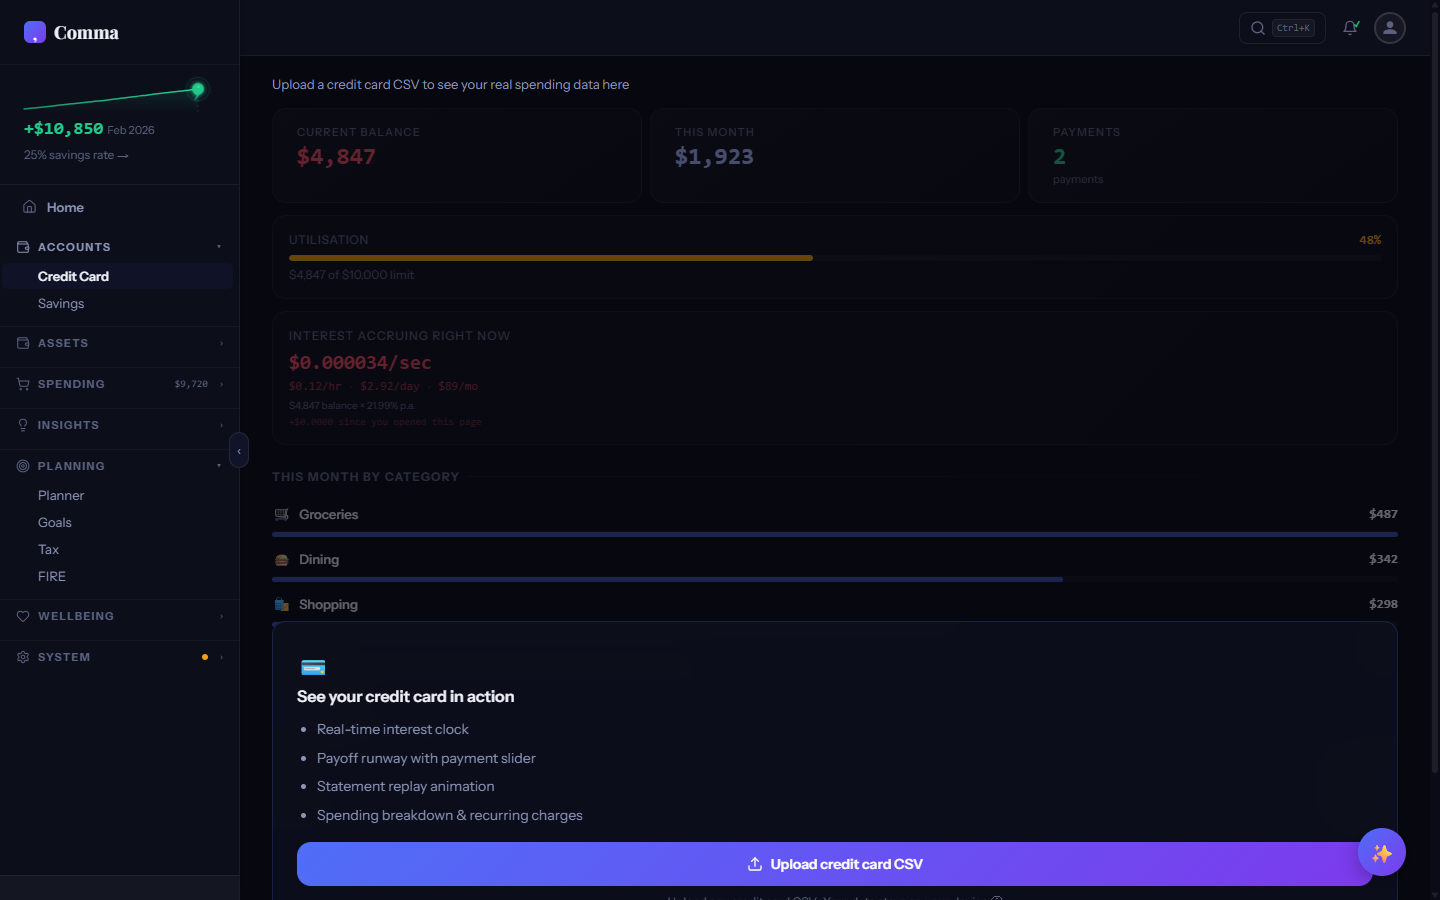
What does the Credit Card tab show?
The Credit Card tab tracks your credit card balance, interest accrual, and payoff timeline. It includes an Interest Clock that visualises how much interest accumulates daily, a Payoff Runway showing how long until the balance reaches zero at your current payment rate, and a Statement Replay that animates your monthly statement as a timeline of charges and payments.
What does the Savings tab show?
The Savings tab tracks your savings progress with a growing landscape visualisation, a streak ring showing consecutive months of positive savings, and a Future You Timeline that projects your savings into the future based on your actual rate. It also shows savings rate benchmarks for your country — the average Australian saves 12%, while the average American saves 8%.
AI Chat
BYO-key AI financial advisor with direct browser-to-provider streaming.
What is AI Chat?
AI Chat is a financial advisor that understands your data. It uses your own API key to stream responses directly from your browser to the AI provider (Anthropic, OpenAI, or Google) — Comma's servers are never in the middle. Ask questions like "What's my biggest spending category?" or "How can I save $500 more per month?" and get answers grounded in your actual transaction data.
Why do I need my own API key?
BYO (Bring Your Own) key means your conversations go directly from your browser to the AI provider. Comma never sees your prompts, your responses, or your financial context. This is a deliberate privacy architecture — no proxy server, no data logging, no middleman. You pay the AI provider directly at their rates (typically a few cents per conversation).
Which AI providers are supported?
Comma supports three providers: Anthropic (Claude), OpenAI (GPT-4o), and Google (Gemini). Each provider has slightly different strengths — Claude excels at nuanced financial analysis, GPT-4o is strong on structured reasoning, and Gemini offers competitive pricing. You can switch providers at any time from Settings > AI. Each provider's API key is stored separately — switching providers never exposes one key to another.
Does Comma see my AI conversations?
No. AI Chat uses a direct browser-to-provider architecture — your API key, prompts, and responses travel directly between your browser and the AI provider's API. Comma's servers are not involved in any way. The financial context sent to the AI is built locally from your transaction data and never leaves your device except to the provider you chose.
Can I use voice input?
AI Chat supports voice input via your browser's built-in speech recognition (Web Speech API). Click the microphone icon and speak your question — it's transcribed locally and sent as text to the AI provider. Voice input works best in Chrome and Edge. No audio is recorded or transmitted to Comma.
Can I hide personal details from the AI?
Yes. Enable "Redact personal info" in Settings > AI to strip identifying details before they leave your browser. With this toggle on, your name, account nicknames, goal names, and health category names are replaced with generic labels (e.g. "Account 1", "Goal 2", "Health Category 1") in the financial context sent to the AI. Dollar amounts, percentages, and general spending categories (Groceries, Dining, etc.) are always sent — redaction is about masking identity, not blanking your data.
Is there a limit on how many AI messages I can send?
A daily request counter is shown as a small pill in the AI Chat header. It resets at midnight local time. At 40 requests you'll see an amber warning; at 50 the chat is paused for the rest of the day. This cap is a safeguard against accidental runaway usage — a typical conversation uses 1–3 requests, so the limit won't affect normal use. It applies per browser and is tracked locally, not on Comma's servers.
Can the AI create goals for me?
Yes. Ask the AI something like "Create a goal to save $10,000 for a holiday by December" and it will populate the Add Goal form automatically with the name, target amount, and date pre-filled. You review and confirm before anything is saved — the AI can't write to your data directly. This works with any supported provider.
Command Palette
Quick search and navigation with keyboard shortcuts.
How do I open the Command Palette?
Press Ctrl+K (Cmd+K on Mac) from anywhere in the app. You can also click the search icon in the top navigation bar. The palette opens as a modal overlay with a search input — start typing to filter results instantly.
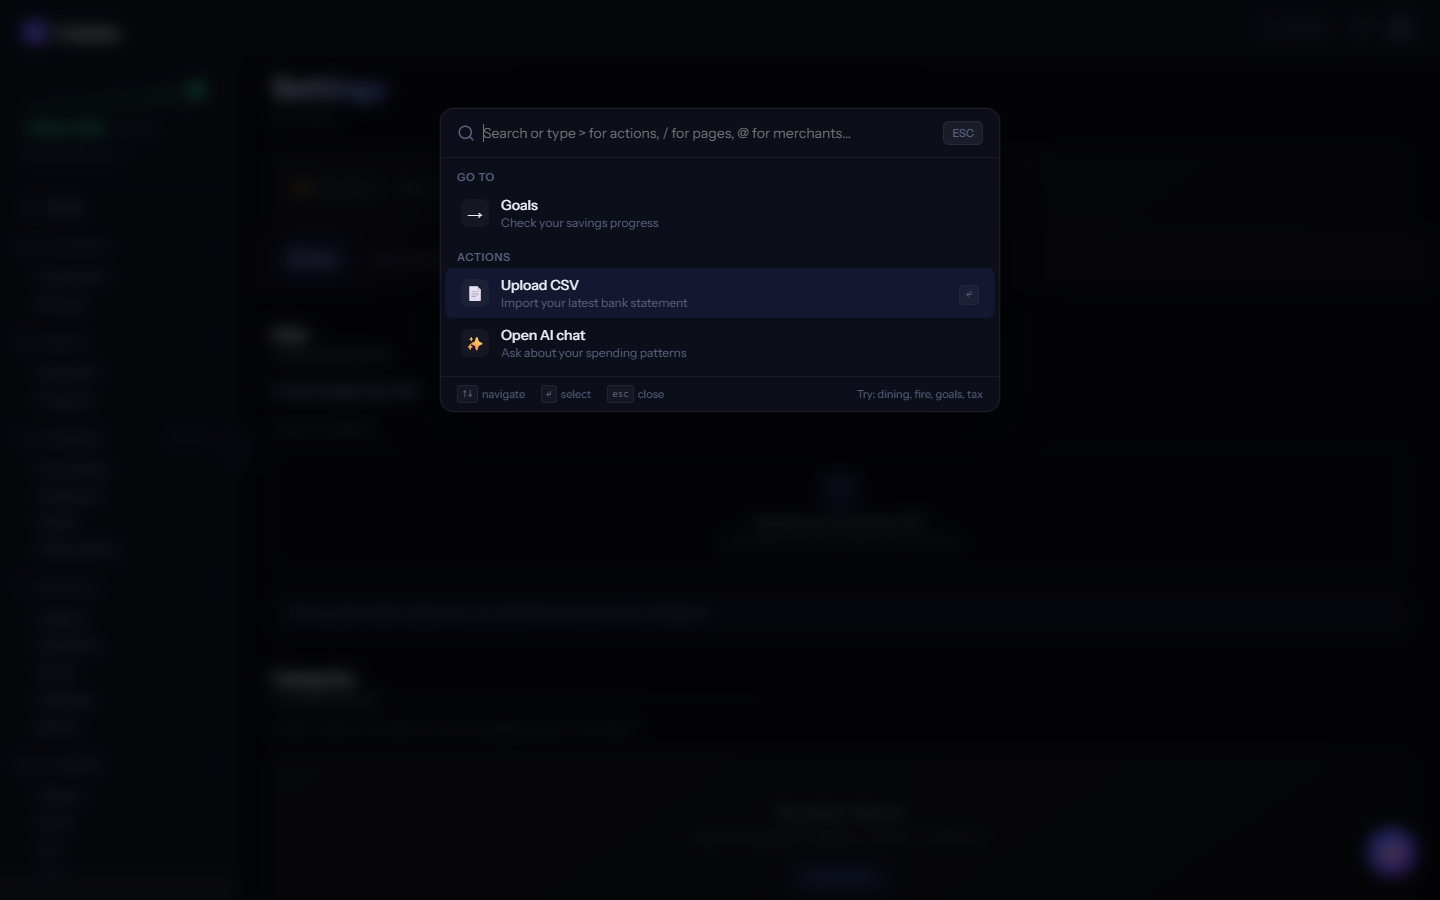
What are scoped search prefixes?
The Command Palette supports scoped prefixes to narrow results: ">" for actions (toggle dark mode, export data), "/" for pages (navigate to any tab), and "@" for merchants (find transactions by merchant name). Type the prefix then your query — for example, ">export" shows export-related actions, "/tax" jumps to the Tax tab.
Does the search support fuzzy matching?
The Command Palette uses fuzzy matching — you don't need exact names. Typing "netw" matches "Net Worth," "subs" matches "Subscriptions," and "cat" matches "Categories." Results are ranked by relevance with the best match highlighted at the top.
What is Smart Summary?
When you search for a tab in the Command Palette, the result preview shows a Smart Summary — a one-line contextual snippet pulled from your data. For example, searching "tax" shows "Effective rate 24% — you keep 76% of every dollar" and searching "goals" shows your top goal's progress. These summaries help you decide whether to navigate before clicking.
Export
Export your data in CSV, Excel, or PDF format.
What export formats are available?
Comma exports in three formats: CSV (universal spreadsheet compatibility), XLSX (Excel with formatted headers and multiple sheets), and PDF (formatted reports with charts). All exports are generated entirely in your browser — no server processing, no data transmission. The raw transaction data never leaves your device during export.
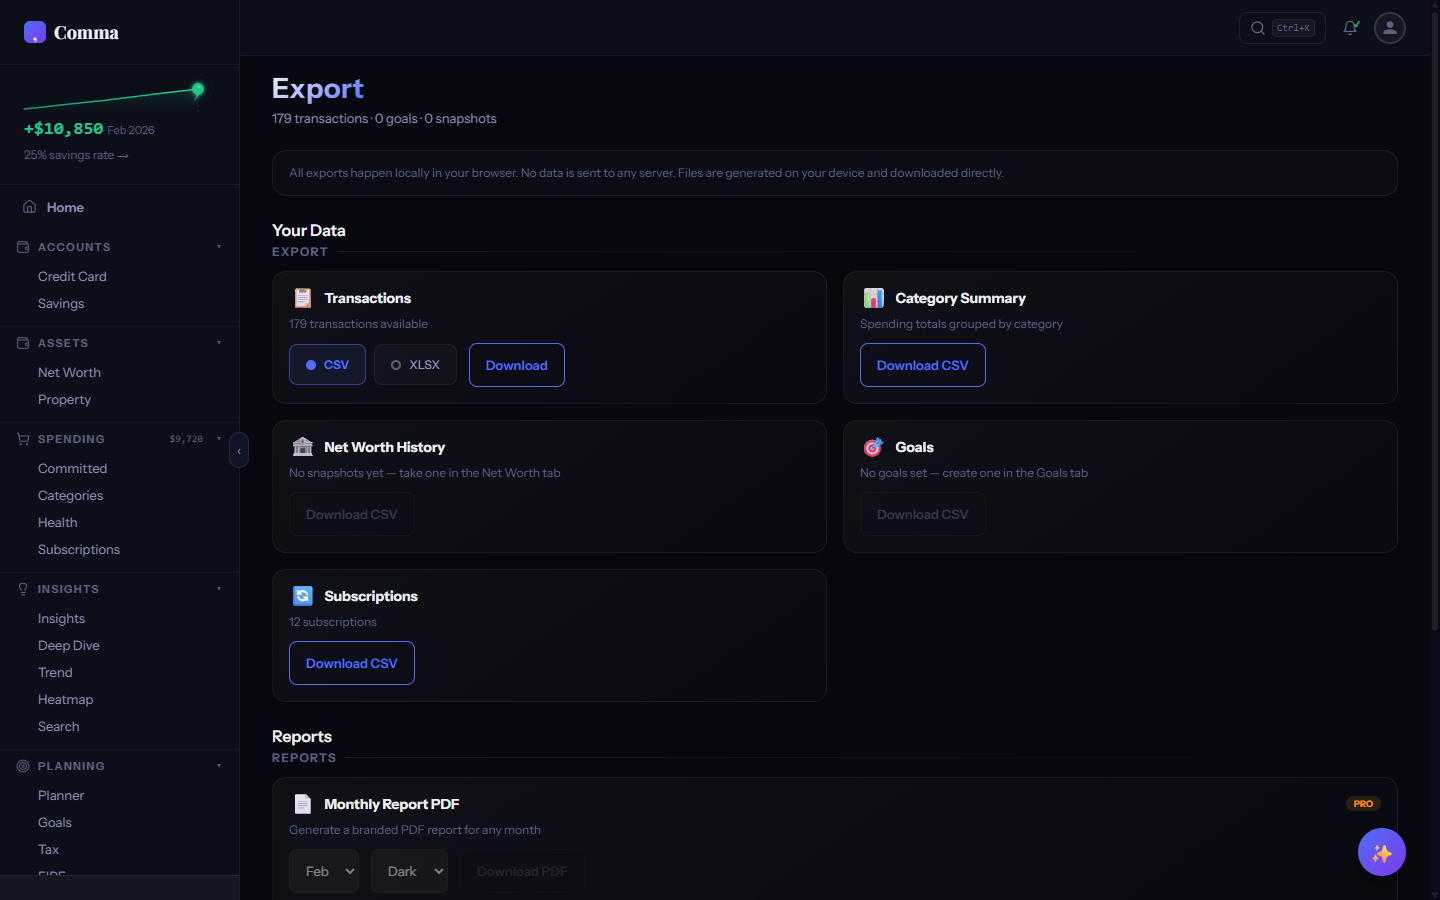
What data can I export?
You can export transactions (with Comma's categories applied), category summaries (monthly totals by category), net worth snapshots (timeline of assets and liabilities), goal progress, subscription list, and a full data backup. Each export type has its own section in the Export tab with format options.
How do I export data for my accountant?
Use Export > Transactions with the "Include tax flags" option to generate a spreadsheet with all transactions that Comma has flagged as potentially tax-deductible. The export includes date, merchant, amount, category, and tax flag columns. Your accountant can filter by the tax flag column to focus on deduction-eligible items.
Can I back up all my Comma data?
Export > Full Backup creates a JSON file containing all your uploaded CSVs, custom categorisation rules, net worth snapshots, goals, preferences, and settings. This backup can be re-imported to restore your complete Comma state on a new device or browser. The backup file is not encrypted — treat it with the same care as your bank statements.
Encryption & Privacy
AES-256-GCM encryption, encrypted on your device before storage.
How is my data encrypted?
Your password never leaves your browser. Comma uses Argon2id (memory-hard, expensive to brute-force) to derive both an authentication token and a wrapping key from your password — entirely on your device. Only the authentication token reaches our servers, where it's bcrypt-hashed again before storage. Your data encryption key is wrapped using AES-KW with the wrapping key, and the wrapped result is stored on the server. We never see the unwrapped key, the wrapping key, or your password itself. The data itself is encrypted with AES-256-GCM via the Web Crypto API — the same standard used by governments and banks. If our database were exfiltrated, an attacker would have encrypted blobs, salts, and KDF parameters; recovering one user's data would mean running Argon2id (32 MiB memory per attempt) plus bcrypt (cost-12) on every guess of that user's password. Tuned to be expensive.
What happens if I forget my password?
Your password IS the encryption key — there is no password reset, no recovery email, no backdoor. This is by design. If you forget your password, the encrypted data on our servers is mathematically unreadable. Your local browser data (localStorage) remains accessible until you clear it, but cloud-synced data cannot be recovered without the correct password.
What happens if Comma's servers are breached?
An attacker would obtain encrypted blobs, salts, KDF parameters, and bcrypt-hashed authentication tokens — none of which reveal your password or your data. Each user's data is encrypted with a unique key derived from their individual password (which never leaves their browser); there are no master keys and no admin decryption capabilities. Recovering a single user's data would require running Argon2id (32 MiB memory per attempt) plus bcrypt (cost-12) on every guess of that user's password — tuned to be expensive. An attacker would still see metadata: your email, signup date, and the size and timing of your encrypted uploads. The financial content itself stays encrypted.
Is CSV import more private than bank API connections?
Significantly. Bank API connections (Plaid, Yodlee, MX) create a persistent pipeline: the aggregator holds your bank credentials, receives your transactions in real time, and stores them on their servers indefinitely. CSV import gives you complete control — you download the file from your bank, upload it to Comma in your browser, and the data is processed locally. Your bank never knows Comma exists, and no third party holds your credentials.
How do I delete all my data?
Go to Settings > Account, scroll to the "Delete Account" section, and click Delete account. The button asks you to confirm; on the second click your encrypted data, vault record, and Supabase auth record are permanently removed from Comma's servers, and your local browser storage is wiped. The deletion is irreversible — once confirmed, even Comma cannot restore your transactions, because the underlying data was encrypted with a key derived from your password. Note: your Stripe customer record (if you ever paid) is preserved for billing-history reasons; contact Stripe support if you also want it removed.
What processing happens in my browser vs on a server?
Everything computational happens in your browser: CSV parsing, bank detection, merchant categorisation, tax calculations, FIRE simulations, Monte Carlo, chart rendering, PDF generation, and encryption. The only server interaction is (a) Supabase auth for account management, (b) storing/retrieving encrypted blobs for cloud sync, and (c) Stripe for payments. No server sees your transaction content in readable form — the encrypted blobs we store are unreadable without your password.
Bank Export Guides
Step-by-step CSV export instructions for major banks.
How do I export from Commonwealth Bank (CBA)?
Log in to NetBank > select your account > click "Export" or "Download transactions" > choose CSV format > select your date range (up to 2 years) > click Download. Upload the downloaded .csv file to Comma. CBA files are auto-detected — no column mapping needed.
How do I export from ANZ?
Log in to ANZ Internet Banking > Your Accounts > select the account > Transactions > Export > choose CSV > set date range > Download. ANZ exports include date, amount, and description columns. Comma detects the ANZ format automatically.
How do I export from NAB?
Log in to NAB Internet Banking > Accounts > select account > Transaction history > Export > CSV format > choose dates > Download. NAB CSVs are detected automatically by Comma.
How do I export from Westpac?
Log in to Westpac Online Banking > Accounts > select account > Search & export > Export transactions > CSV > set dates > Export. Westpac and St.George use similar formats — both are auto-detected.
How do I export from Up Bank?
In the Up app, go to Activity > tap the "..." menu > Export > choose CSV > select date range > Share/Save the file. Up Bank's CSV format includes detailed merchant data and is fully auto-detected by Comma with rich category matching.
How do I export from Monzo?
In the Monzo app or web, go to your account > tap "Export" in the summary or account settings > choose CSV > select date range. Monzo exports two formats (with and without enriched data) — Comma detects both automatically.
How do I export from Chase (US)?
Log in to chase.com > select account > Account activity > Download account activity > choose "CSV" format > set date range > Download. Chase exports checking and credit card statements in different formats — Comma detects both.
My bank isn't listed. Can I still use Comma?
Almost certainly. If your bank offers CSV export (most do), upload the file and Comma will attempt auto-detection. If the format isn't recognised, a Column Mapping Modal appears where you manually tell Comma which columns are Date, Amount, and Description. Your mapping is saved by header hash so you only do it once per bank format.
How do I submit my bank so Comma adds it to auto-detect?
Two entry points: 1. Bank Instructions drawer — click the "Don't see your bank? Submit it →" link at the bottom of the bank list. 2. Inside the manual column-mapping flow, when Comma couldn't auto-detect your CSV — there's a "Help us support your bank automatically" prompt at the top. Both open the same modal. Drop your CSV in. Comma extracts only the column header row from the file (e.g. "Date,Description,Amount,Balance") and submits that plus your bank name guess + country. The actual transaction rows never leave your browser. Optionally tick "Notify me when this ships" with your email and Comma will email you when a parser is shipped for that format. New bank parsers get released in patch versions — usually within a few weeks of submission.
My bank only offers PDF statements. Can I use those?
Comma accepts CSV files only — if you drop a PDF or XLSX file, Comma will reject it with a clear message explaining why. PDFs are designed for printing, not structured data, and every bank formats them differently. Most banks offer CSV export through their online banking portal even if the default download is PDF. Check your bank's "Export," "Download," or "Transaction history" section and look for a CSV option. See the bank export guides below for step-by-step instructions.
Account & Billing
Pricing tiers, payments, and account management.
What are the differences between Free, Pro, and Lifetime?
Free: full dashboard, all tabs, 30 days of history, smart categorisation, net worth tracking, Comma Spark, 1 net worth snapshot. Pro (one-time payment): 12 months of history, AI chat, goal projections, tax planning tools, trend & deep dive analytics, unlimited snapshots. Lifetime (one-time payment): unlimited history, every current and future feature. No subscriptions — both paid tiers are one-time purchases.
How much does Comma cost?
Pro: $149 AUD / $99 USD / £79 GBP / $149 NZD / $129 CAD (one-time). Lifetime: $299 AUD / $199 USD / £149 GBP / $279 NZD / $249 CAD (one-time). Prices are localised — you're charged in your local currency. No monthly or annual subscriptions.
What is the refund policy?
Comma offers a 30-day refund policy. If you're not satisfied with your purchase, contact hello@comma.finance within 30 days for a full refund, no questions asked.
How are payments processed?
Payments are processed by Stripe, which acts as the Merchant of Record. Comma never sees or stores your credit card details — Stripe handles the entire payment flow via an embedded checkout form. Your card details go directly to Stripe's PCI-compliant infrastructure.
How do I delete my account?
Go to Settings > Account and scroll to the "Delete Account" section at the bottom. Click "Delete account", then click again to confirm. Your auth record + all encrypted data on Comma's servers + your local browser storage are removed. The action is irreversible. Your Stripe customer record (if you ever paid) is intentionally preserved for billing history; if you want it deleted too, email Stripe support directly.
Why doesn't Comma charge a monthly subscription?
Comma's architecture means server costs are minimal — all computation happens in your browser, and the only server usage is storing small encrypted blobs. This lets us offer one-time pricing instead of extracting monthly fees. You pay once, you own it. No surprise charges, no fee increases, no "your trial has expired" nag screens.
Search & Transactions
Full-text transaction search with category filtering and recategorisation.
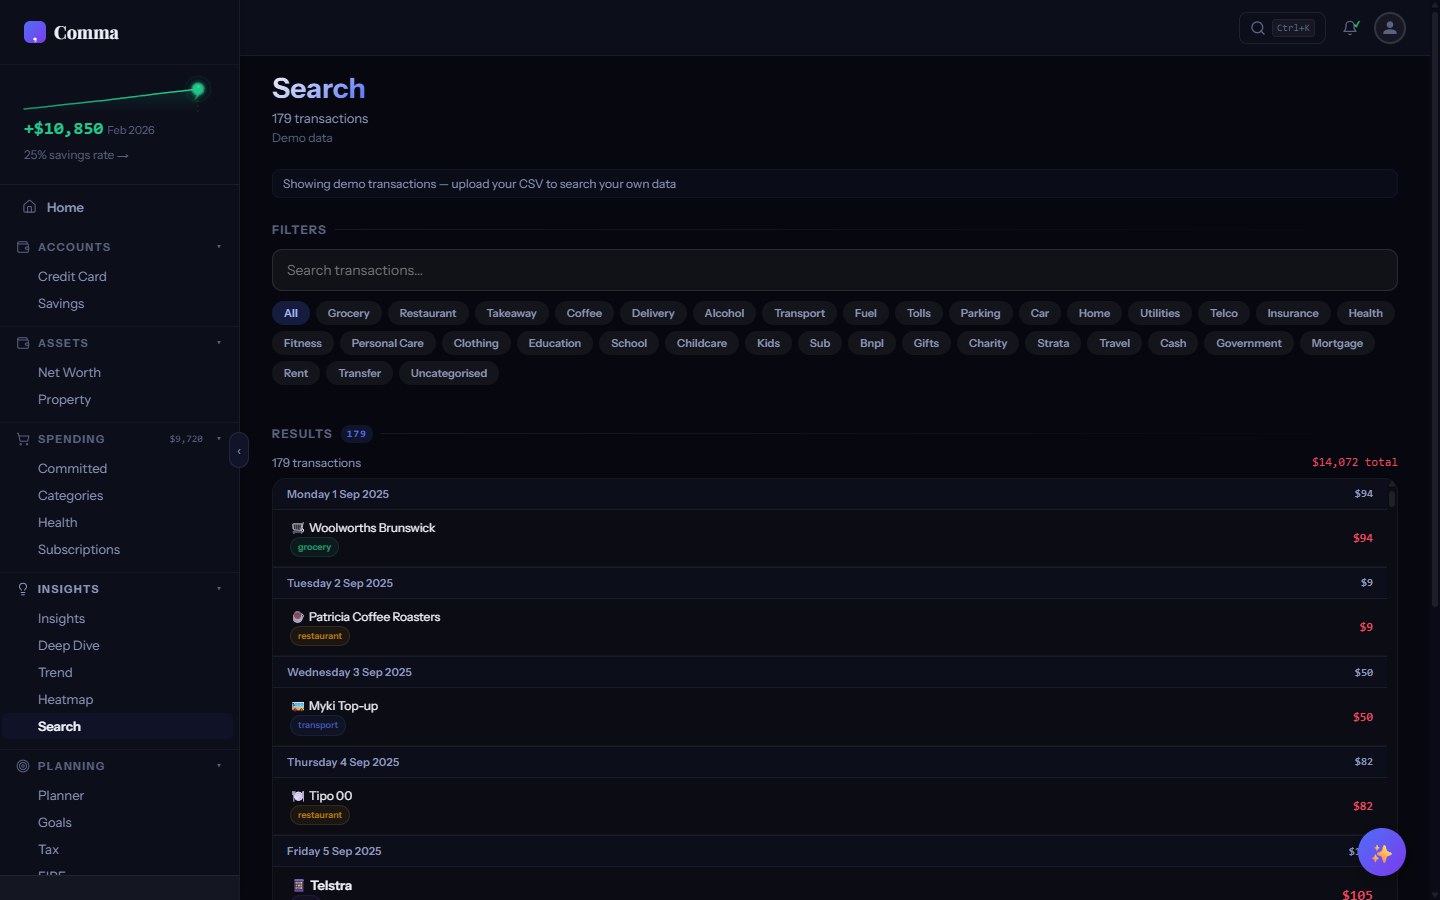
How does transaction search work?
The Search tab provides full-text search across all your imported transactions. Type a merchant name, amount, or keyword and results filter instantly. You can also filter by category using the dropdown, or combine text search with category filtering to narrow results further.
How do I recategorise a transaction?
Tap any transaction in Search to open a category picker. Select the correct category and Comma creates a merchant rule — all past and future transactions from that merchant are automatically recategorised. This is how you teach Comma your spending patterns one merchant at a time.
Can I search with keyboard shortcuts?
Press "/" from anywhere in the app to jump to the Search tab with the search input focused. Press Ctrl+K to open the Command Palette for a quicker scoped search. In the Search tab, use arrow keys to navigate results and Enter to select.
How do I see which file a transaction came from?
Tap the paperclip icon (📎) on any transaction row in Search to open the provenance popover. It shows the exact filename, import date, and account it belongs to. This is useful when the same merchant appears across multiple uploaded files and you want to confirm which statement a specific charge came from.
Insights & Analytics
Day-of-week patterns, spending trends, heatmaps, and deep dives.
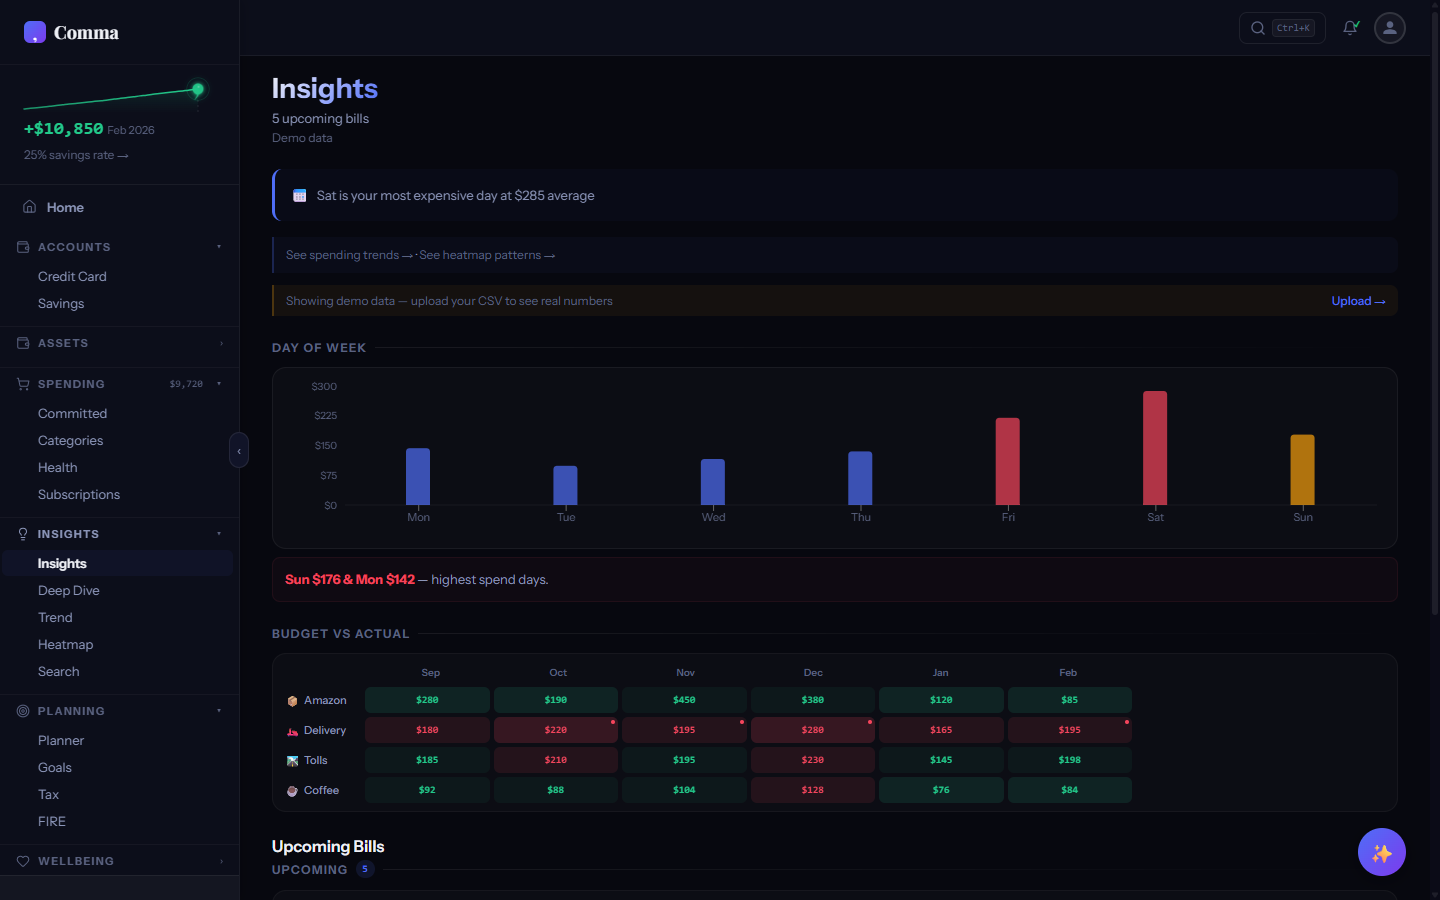
What does the Insights tab show?
The Insights tab reveals spending patterns you might not notice manually — day-of-week analysis (do you spend more on Fridays?), top spending categories with month-over-month comparison, upcoming-bills projection from your detected recurring charges, and contextual insights generated by Comma's rule-based engine. Each insight links to the relevant tab for deeper exploration.
How does the Upcoming Bills section work?
The Upcoming Bills section projects when your detected recurring charges will hit next, sorted by date and tagged with urgency colour (red for ≤7 days / overdue, amber for ≤14 days, muted for further out). A summary banner at the top totals up everything due in the next 30 days. For variable-cadence bills like utilities (which arrive every 28-32 days, not exactly monthly), the date renders as a range — "May 12-16" instead of fake-precision "May 14". Stable subscriptions with predictable cadence collapse to a single date. Two confidence tiers: • Confirmed-recurring — projected from 3+ confirmed occurrences. These render at full opacity and sort first. • Possible — based on 2 prior occurrences plus a category keyword match (e.g. an annual insurance renewal we've only seen twice). These render at 70% opacity with a small italicised "possible" tag and sort below confirmed bills. A matching but smaller version appears on the Overview tab as the Upcoming Bills widget for at-a-glance reading.
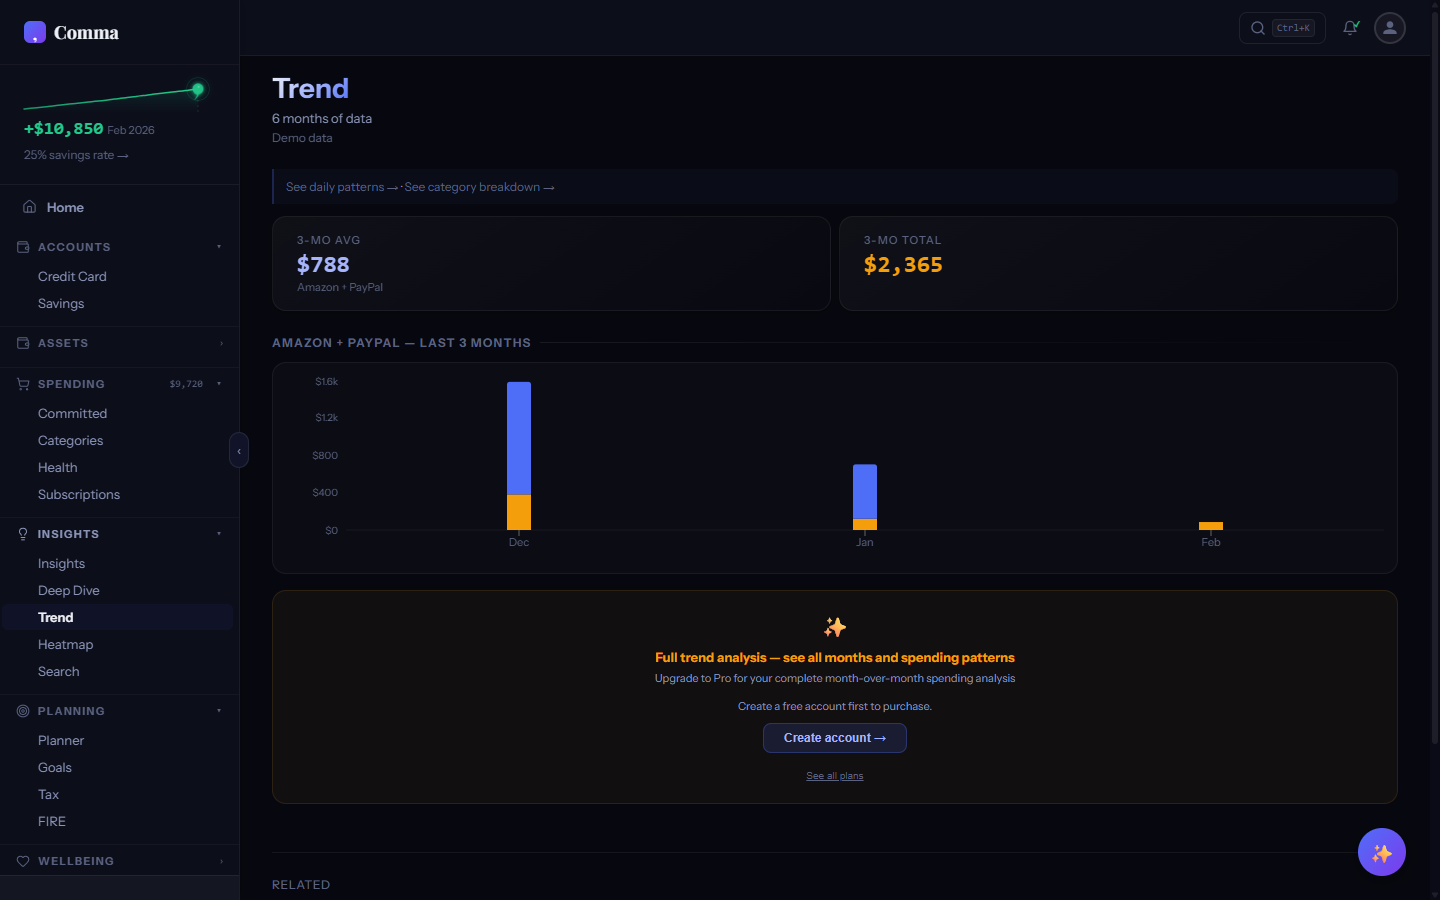
What does the Trend tab show?
The Trend tab shows your income, spending, and net surplus/deficit over time as an area chart. Stat cards at the top show your current period net, recent average, and direction of change. It's the best single screen for answering "am I getting better or worse at saving?"
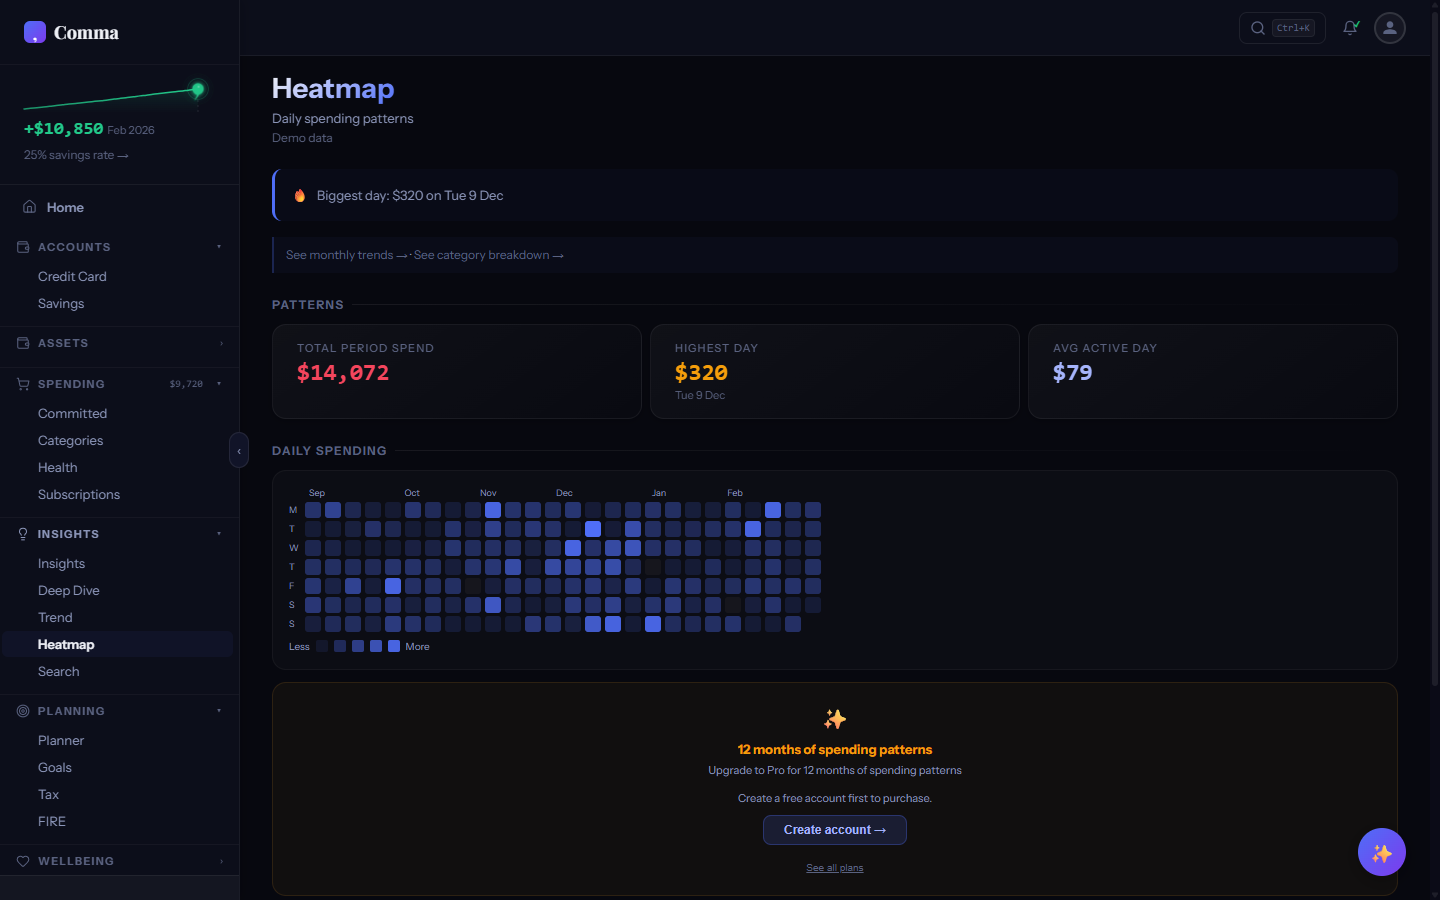
What is the spending heatmap?
The Spending Heatmap tab shows a calendar-style grid where each cell represents a day, coloured by spending intensity. Darker cells mean higher spending. The visual makes weekly and monthly patterns obvious — you might discover you consistently overspend on Fridays or that the first week of each month is your heaviest.
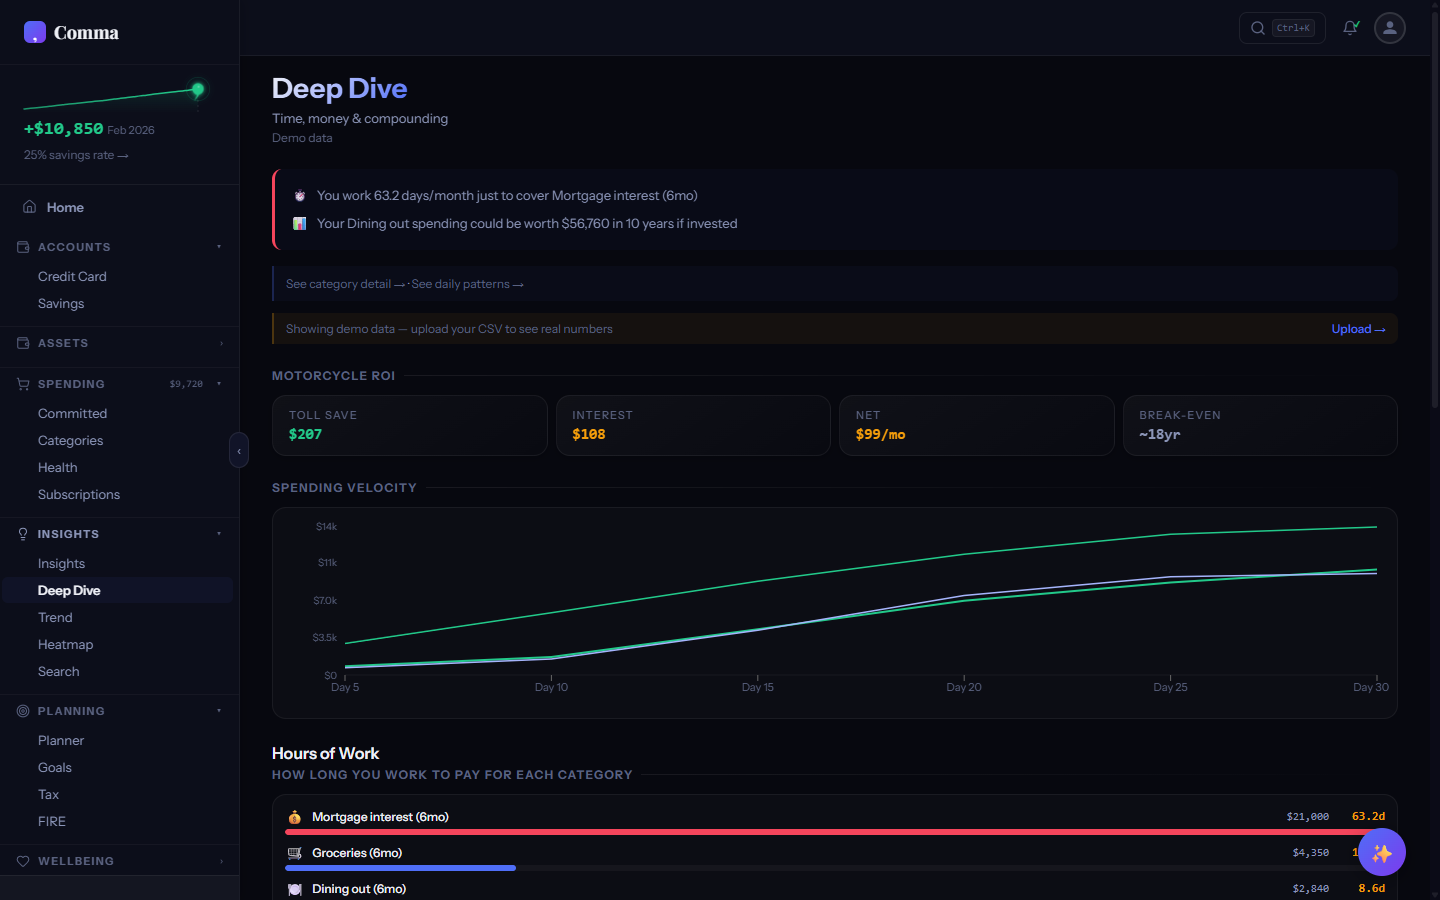
What is Deep Dive?
The Deep Dive tab provides advanced analytics: Spending Velocity (daily spend rate with projection), Hours to Earn (how many work hours each purchase costs), Compound Impact (how small daily savings grow with investment returns over 10-30 years), and a Financial Scorecard grading you across multiple dimensions.
Committed Spending
Fixed expenses like rent, insurance, and utilities.
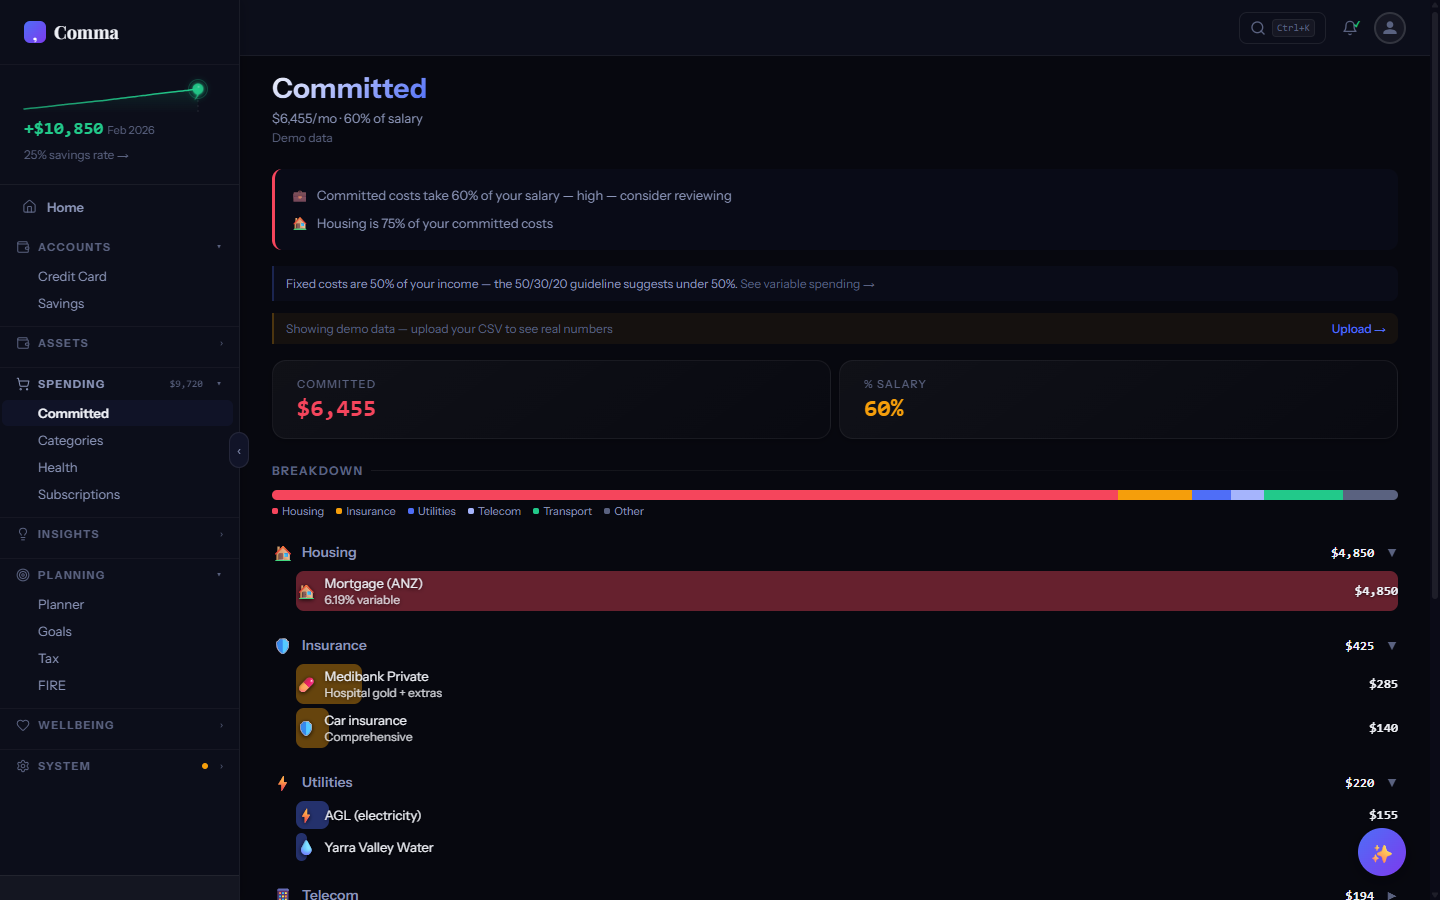
What is committed spending?
Committed spending is your fixed, recurring monthly obligations — rent or mortgage, insurance, phone/internet, electricity, gas, water, childcare, loan repayments. The Committed tab populates automatically from your transaction history: Comma detects merchants that recur on a regular cadence (monthly, quarterly, etc.) and groups them by category (Housing, Utilities, Insurance, Telecom, Education, Other). Each row shows the median amount, the cadence ("Monthly", "Quarterly"), and a variance annotation when the bill swings ("±12% variance" for utility-style bills that change with usage). The proportional bar at the top breaks down totals by category so you can see at a glance what proportion of your income is locked in before any discretionary spending happens.
What's the difference between committed and variable spending?
Committed costs are fixed recurring obligations you can't easily change month to month (rent, insurance, telco, utilities). Variable spending is discretionary — groceries, dining, entertainment, shopping. The Planner tab uses this distinction to show which expenses are adjustable via sliders and which are locked in.
Why does my Telstra / AGL / Uber show up here instead of Subscriptions?
Mandatory bills (phone, internet, utilities, insurance, childcare, mortgage) and pay-per-use services (Uber, Lyft, DoorDash, Deliveroo, Menulog) always route to Committed regardless of how stable their amounts are. They're committed life costs, not subscription relationships — you can cancel Netflix; you can't really cancel electricity. Genuine subscription products from per-use brands still appear correctly on Subscriptions: Uber One, DashPass, Deliveroo Plus, GrubHub+ are all routed there because they're actual service-relationship subs, not per-trip charges. If you have a Telstra bill that's exactly $89/mo every month, Comma will still classify it as Committed (Telecom group) rather than treating the flat amount as evidence of a subscription. The conceptual category beats the variance signal.
What does "Previously: …" mean under a row?
Chain rendering. When you change apartments, switch gyms, or otherwise migrate from one merchant to another in the same category, Comma detects the transition and represents the chain as a single active row with a muted-italic trail underneath: "Previously: Apartment 1 → Apartment 2". The trail keeps your spending picture continuous instead of showing three separate rent rows. The active entry — the one currently occurring — is what counts toward your Committed total; the predecessors are listed for context but excluded from the headline number to avoid double-counting. Detection looks for two conditions per category: the previous entry has stopped occurring (last seen >1.5× cadence ago) and the new entry started shortly after. A short overlap (up to 60 days) is allowed — moving expenses often double up briefly during the changeover.
Property
Property assets, equity tracking, and mortgage balance.
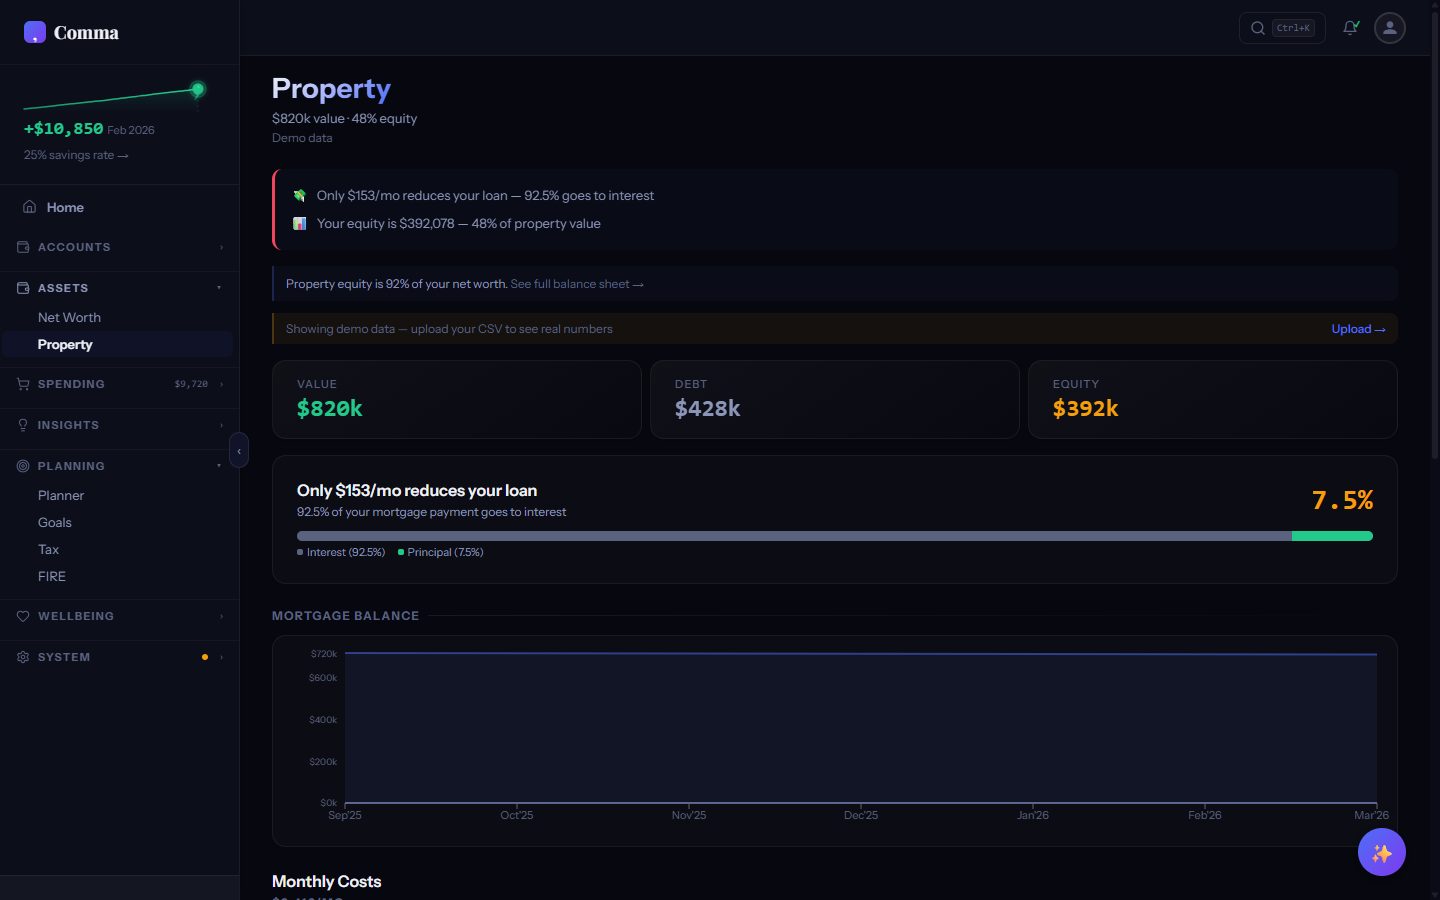
What does the Property tab show?
The Property tab displays your property assets with estimated value, mortgage balance, and equity position. It shows loan-to-value ratio, equity percentage, and how your property equity contributes to your overall net worth. Currently uses manually entered values — planned enhancement for automated property valuation.
Settings
Locale, preferences, data management, and account settings.
How do I change my country/locale?
Go to Settings > Preferences > Locale. Changing your locale updates currency formatting, tax engines, merchant patterns, health cards, and benchmarks to match your country. Supported locales are Australia, United Kingdom, United States, New Zealand, and Canada.
How do I enable or disable the Gambling tab?
Go to Settings > Preferences and toggle "Show Gambling tab." When disabled, the Gambling tab is hidden from the sidebar and menu. Gambling transaction data still exists in your categorised transactions — the toggle only controls whether the dedicated analysis tab is visible.
Can I hide spending categories I don't use?
Go to Settings > Categories to toggle visibility for any of the 60 spending categories. Hidden categories don't appear in the Categories tab breakdown or chart legends, but their transactions are still categorised and counted in totals. This keeps the UI clean if you have categories with zero or negligible spending.
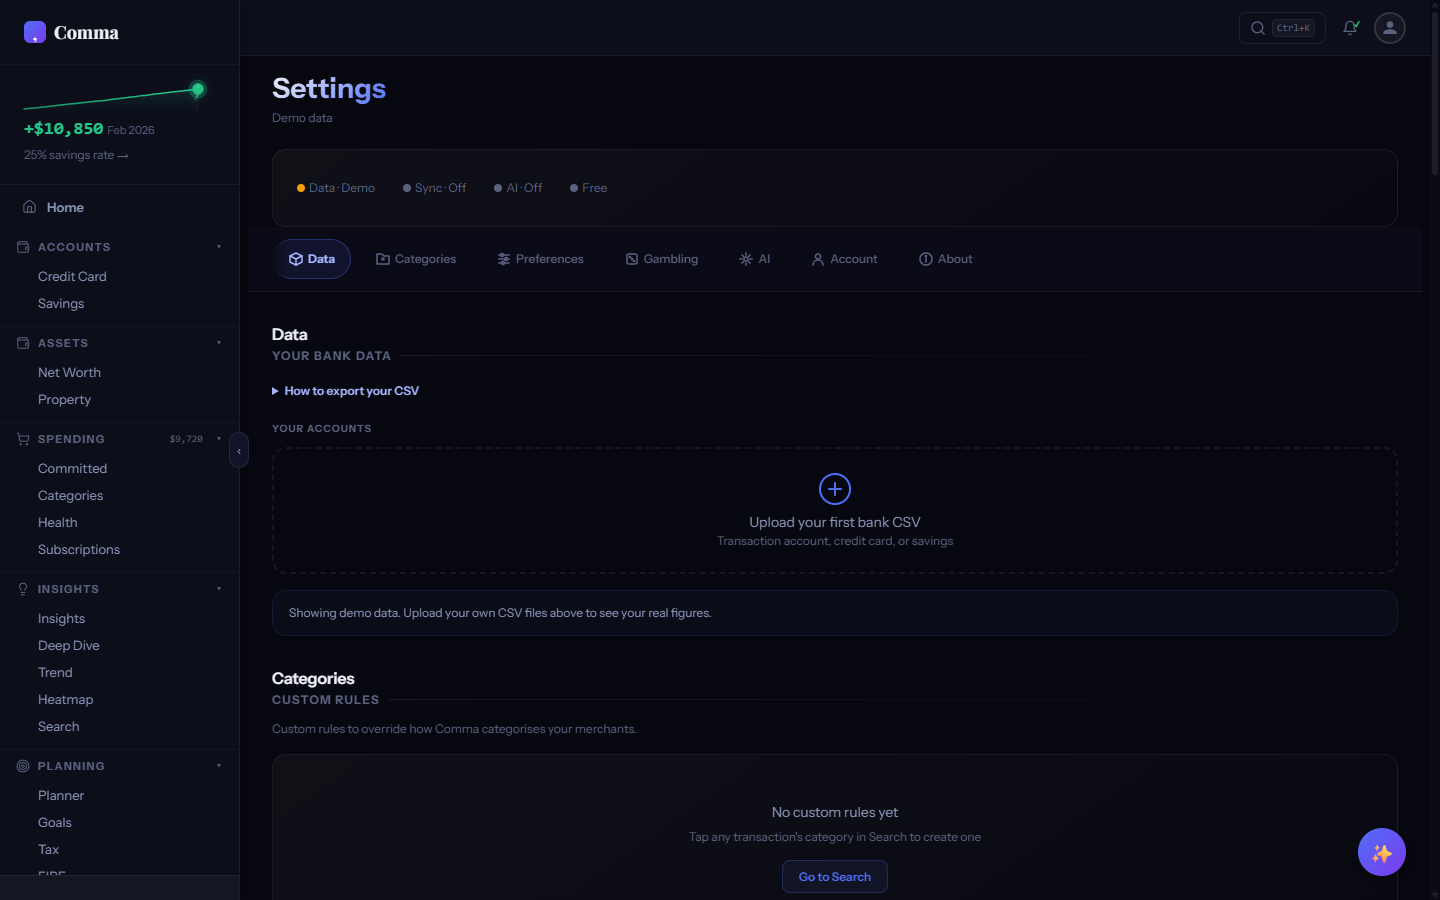
Where is my data stored?
Your transactions live in your browser's localStorage for fast access — uploaded CSVs, parsed data, preferences, and custom rules. An AES-256-GCM encrypted copy syncs to Supabase so you can access your data across devices. The encryption key derives from your password and never leaves your browser, so Comma can't read your data even on its own servers.